
Overview
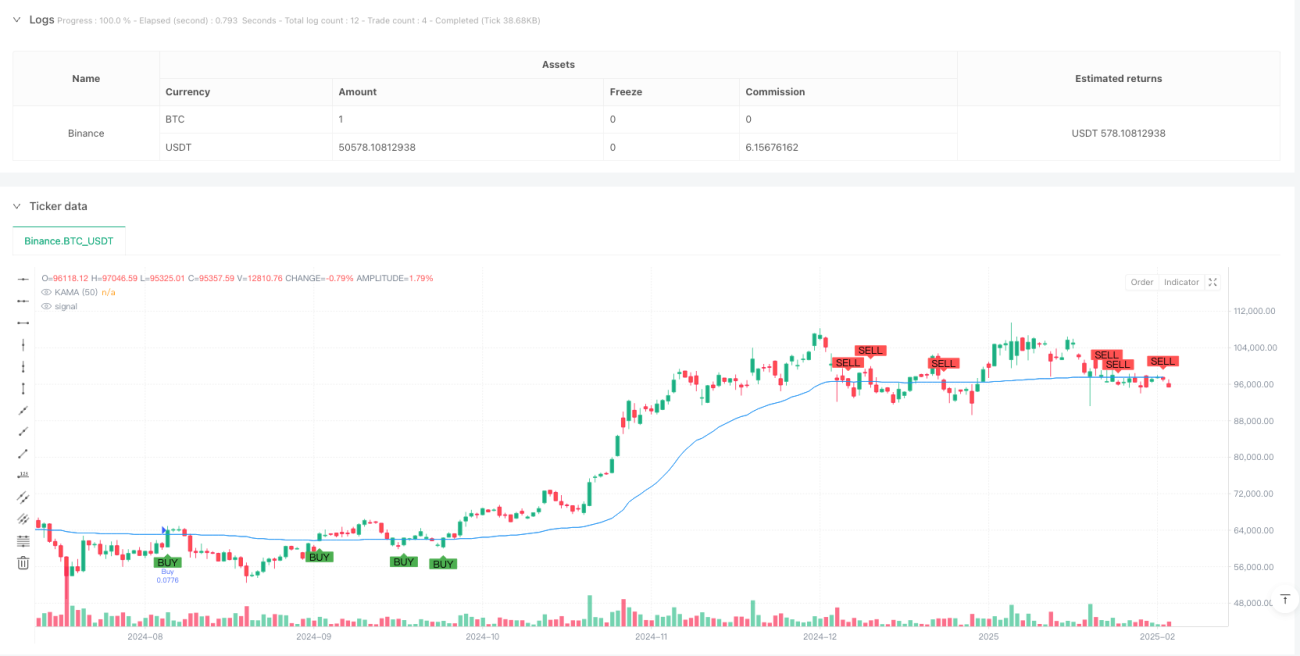
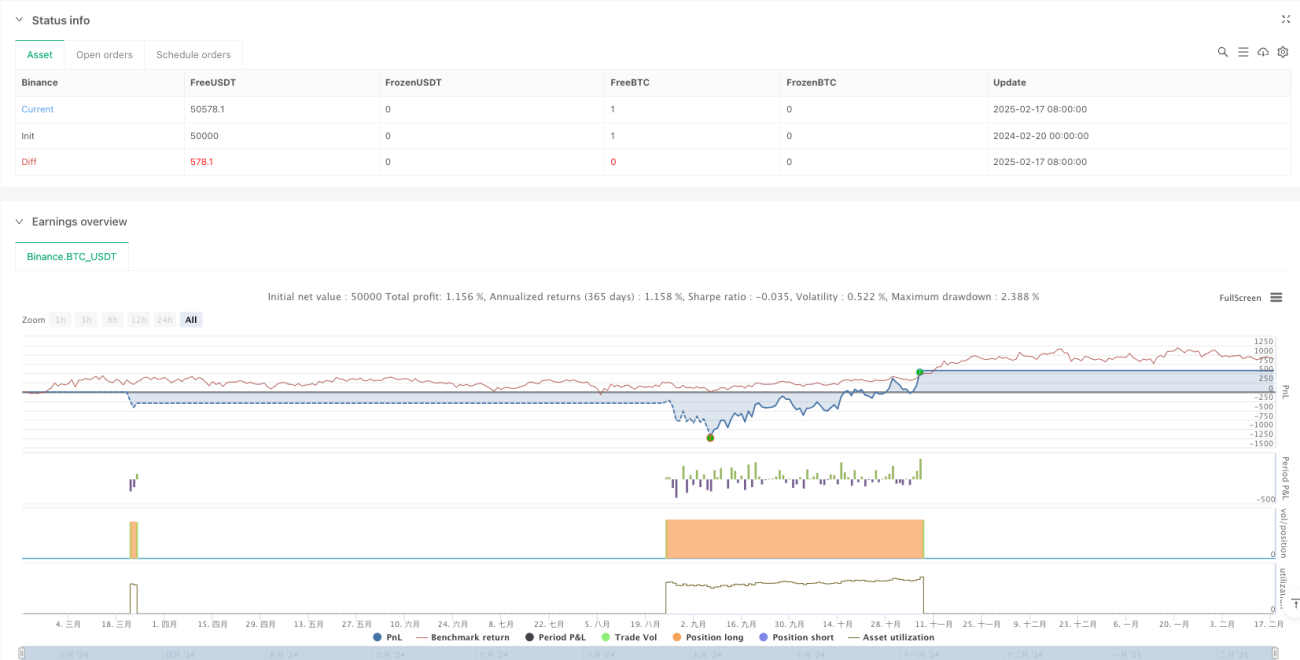
This strategy is a trend-following system that combines the Kaufman Adaptive Moving Average (KAMA) with MACD. It uses KAMA as the primary trend indicator and MACD as momentum confirmation, achieving intelligent trend tracking and precise trade timing. The strategy operates on a 4-hour timeframe with dynamic stop-loss and take-profit targets for risk management.
Strategy Principles
The core logic is based on the following key components:
- KAMA Calculation: Uses a 50-period KAMA as the main trend indicator, dynamically adjusting the smoothing coefficient through efficiency ratio to better adapt to market conditions.
- MACD Confirmation: Employs slower settings (26,52,18) for MACD as trend confirmation, ensuring trade direction aligns with overall momentum.
- ATR Stops: Uses 3 times the 14-period ATR for calculating dynamic stop-loss and take-profit levels.
- Trading Rules:
- Long Entry: Price crosses above KAMA with bullish MACD
- Exit: Price crosses below KAMA with bearish MACD
- Risk Management: Dynamic stop-loss and take-profit based on ATR
Strategy Advantages
- High Adaptability: KAMA automatically adjusts sensitivity based on market efficiency, maintaining good performance across different market conditions.
- Reliable Signals: MACD confirmation significantly reduces false breakout risks.
- Comprehensive Risk Management: Volatility-based dynamic stops and targets provide adaptive risk control.
- Extensive Parameter Optimization Space: Key parameters can be adjusted for different market characteristics.
Strategy Risks
- Trend Reversal Risk: May generate false signals in highly volatile markets.
- Lag Risk: Both KAMA and MACD have inherent lag, potentially missing optimal entry points.
- Parameter Sensitivity: Different market conditions may require parameter adjustments.
- Transaction Cost Impact: Frequent trading may lead to high transaction costs.
Optimization Directions
- Implement market volatility filter to adjust parameters or pause trading in high volatility environments.
- Add volume analysis indicators to improve trend identification accuracy.
- Optimize MACD parameters for better alignment with 4-hour timeframe.
- Implement adaptive stop-loss multiplier to dynamically adjust ATR multiplier based on market volatility.
- Include time filters to avoid trading during low liquidity periods.
Summary
This is an innovative trend-following strategy that combines the classic technical indicators KAMA and MACD. Through the coordination of adaptive moving averages and momentum confirmation, along with a comprehensive risk management system, the strategy demonstrates strong practicality and stability. While it faces certain risks related to lag and parameter sensitivity, the suggested optimization directions can further enhance its robustness and profitability.
- 1