
Overview
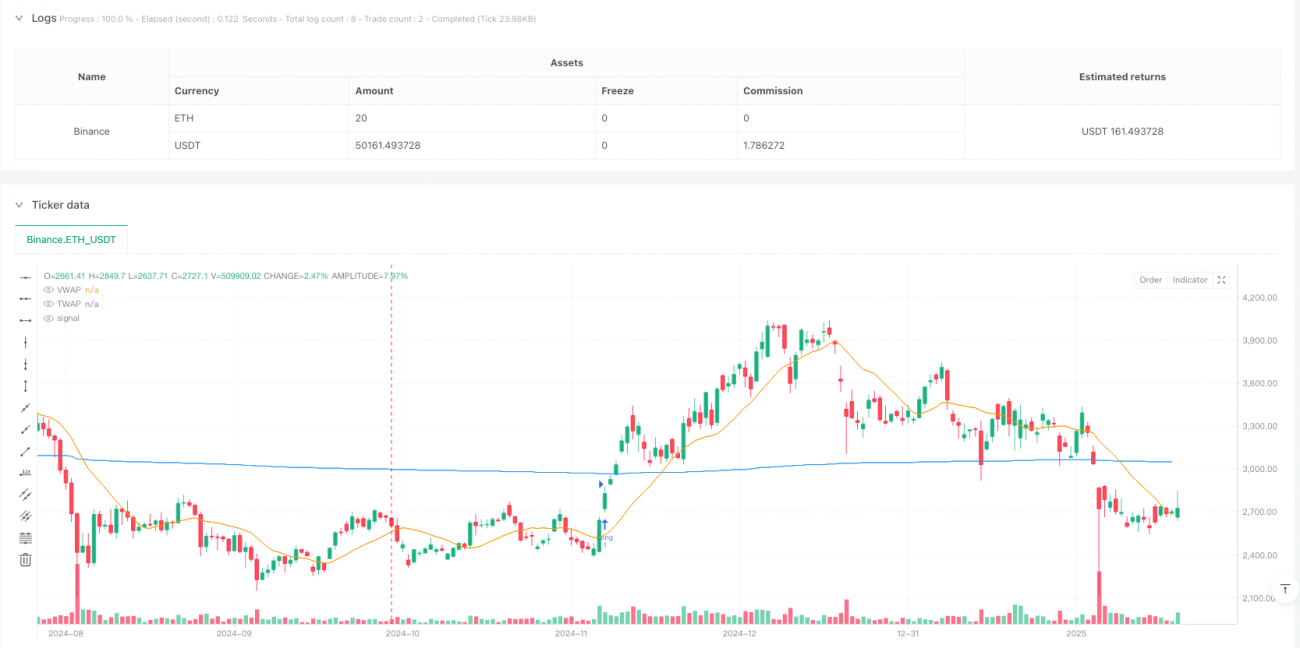
This strategy is a hybrid trading system based on multiple technical indicators, combining Volume Weighted Average Price (VWAP), Time Weighted Average Price (TWAP), volatility breakout, and pattern recognition analysis methods. The strategy determines market entry and exit timing by integrating signals from multiple technical indicators while incorporating volume confirmation to enhance trading reliability.
Strategy Principles
The core logic of the strategy is based on the following key components:
- Using VWAP and TWAP dual moving average system as price trend reference
- Volatility breakout judgment through Bollinger Bands combined with ATR indicator
- Simple head and shoulders and triangle pattern recognition
- Using volume as a necessary condition for trade confirmation
- Setting dynamic take-profit and stop-loss levels based on ATR
The system generates long signals when price breaks above the Bollinger Band upper band, technical patterns appear, and high volume is present. When price loses breakthrough momentum and technical patterns appear, the system closes existing positions. The take-profit is set at entry price plus 2 times ATR, and stop-loss is set at entry price minus 1.5 times ATR.
Strategy Advantages
- Multi-dimensional signal confirmation mechanism significantly improves trading reliability
- Dynamic take-profit and stop-loss settings adapt to market volatility
- Volume confirmation effectively filters false breakouts
- VWAP and TWAP dual moving averages provide more stable price reference
- Clear strategy logic facilitates subsequent optimization and adjustment
Strategy Risks
- Multiple condition confirmation may lead to missed trading opportunities
- May generate frequent false breakout signals in ranging markets
- Simplified pattern recognition processing may lead to misjudgments
- High volume confirmation conditions may not be suitable for low liquidity markets
- Fixed multiple ATR take-profit and stop-loss settings may not suit all market environments
Strategy Optimization Directions
- Introduce market environment recognition mechanism to dynamically adjust strategy parameters under different market conditions
- Improve pattern recognition algorithm to support more technical patterns
- Optimize volume confirmation thresholds to adapt to different market liquidity characteristics
- Add trend strength filter to improve trading signal quality
- Develop smarter take-profit and stop-loss mechanisms that can dynamically adjust based on market characteristics
Summary
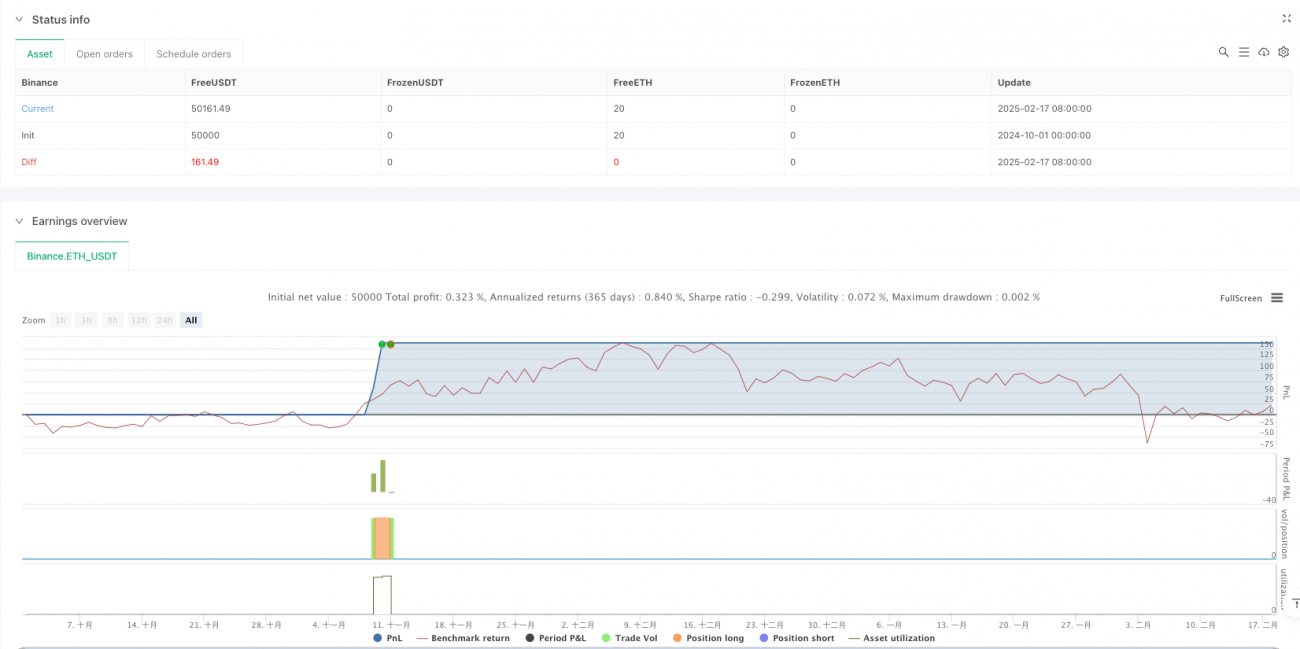
This is a comprehensive trading strategy that integrates multiple technical analysis dimensions, using multiple signal confirmations to improve trading reliability. The core advantage of the strategy lies in its multi-dimensional analysis method and strict trading conditions, which help reduce the risk of false signals. Although there are aspects that need optimization, the overall framework has good scalability and adaptability. Through continuous optimization and adjustment, this strategy has the potential to maintain stable performance in different market environments.
- 1