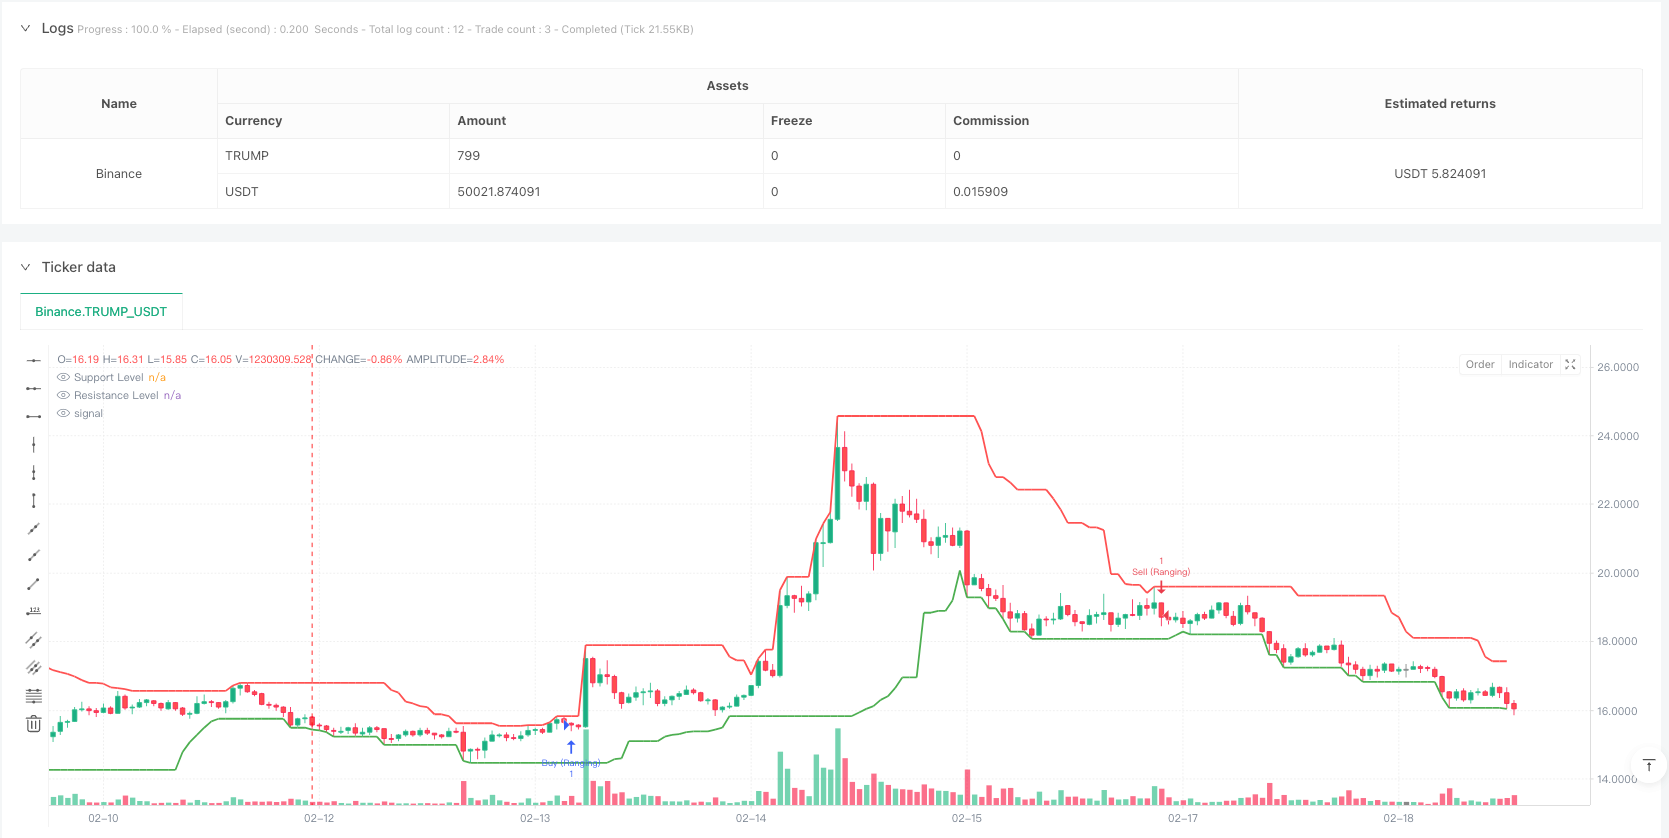
Overview
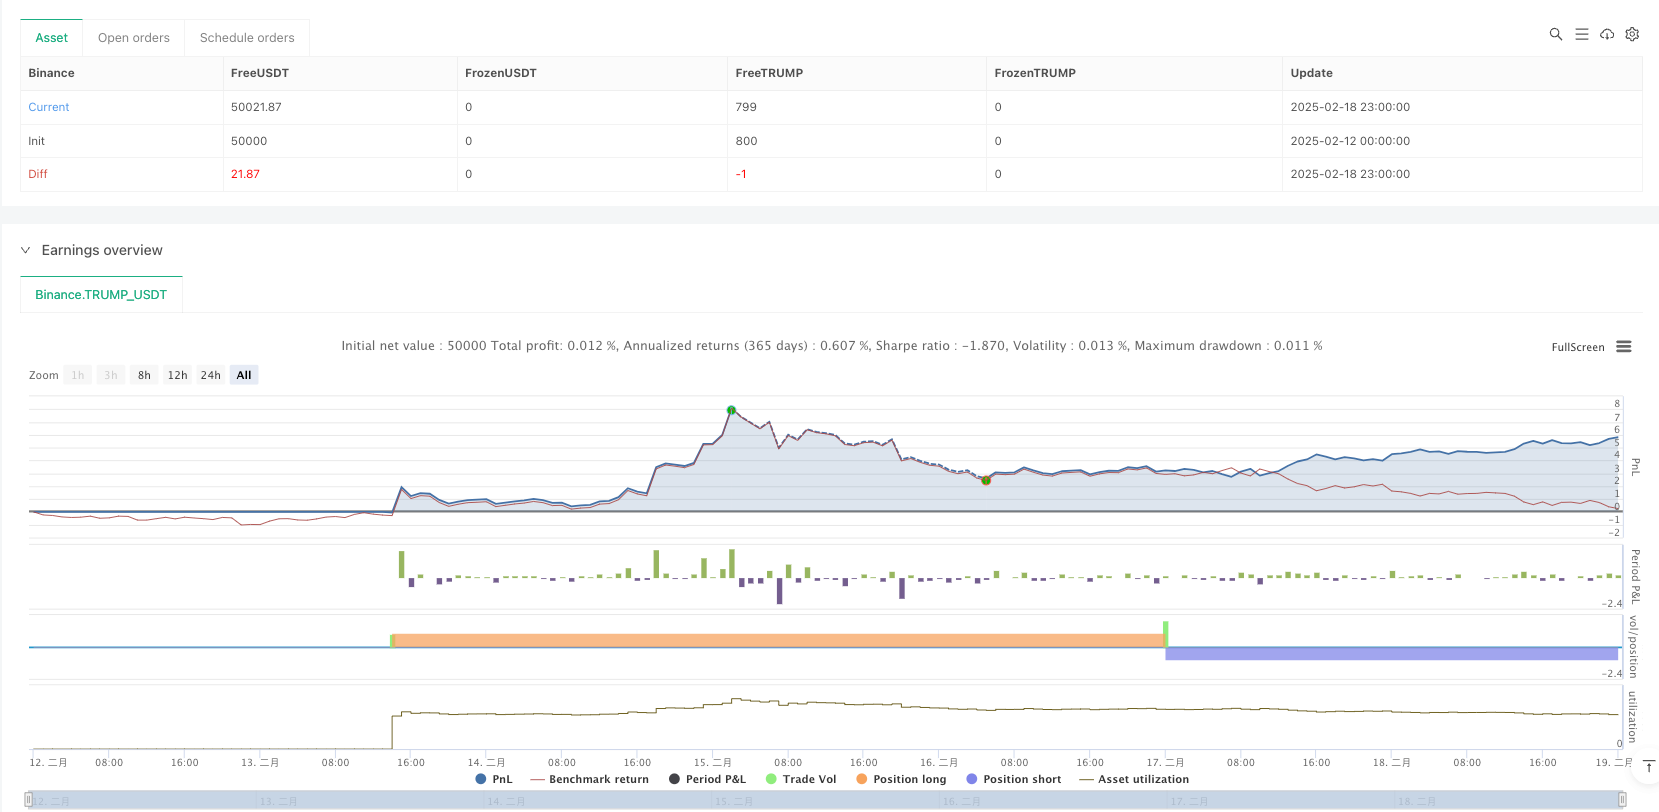
This strategy is a comprehensive trading system based on technical analysis, combining support/resistance zones, candlestick patterns, and market structure analysis. The strategy makes trading decisions by identifying key price levels, confirming candlestick signals, and evaluating overall market trends. The system employs a 1:3 risk-reward ratio with predefined stop-loss and take-profit targets for risk management.
Strategy Principles
The core logic of the strategy is based on several key components: 1. Support/Resistance Zone Identification - Using 20-period high/low to determine key price levels 2. Candlestick Pattern Confirmation - Including bullish engulfing, bearish engulfing, hammer, and shooting star patterns 3. Market Structure Analysis - Determining market conditions (trending up, trending down, or ranging) through high/low sequence comparison 4. Risk Management - Using fixed stop-loss points and 1:3 risk-reward ratio for take-profit placement
The strategy operates in three market environments: trending, ranging, and transitional markets, with different trading rule combinations for each environment.
Strategy Advantages
- Multi-dimensional Analysis - Provides more reliable trading signals by integrating price levels, candlestick patterns, and market structure
- High Adaptability - Capable of adapting to different market environments, including trends and ranges
- Comprehensive Risk Management - Uses fixed risk-reward ratio ensuring clear risk control for each trade
- Visual Support - Marks support/resistance zones graphically, helping traders understand market conditions
Strategy Risks
- False Breakout Risk - Price may quickly retrace after breakout, generating false signals
- Slippage Risk - Actual execution prices may significantly deviate from expected levels during volatile periods
- Parameter Sensitivity - Choice of support/resistance period, market structure period significantly affects strategy performance
- Market Environment Dependency - May underperform in rapid trending or highly volatile markets
Strategy Optimization Directions
- Dynamic Parameter Adjustment - Automatically adjust support/resistance calculation period based on market volatility
- Filter Enhancement - Add volume and volatility indicators to filter false breakout signals
- Stop-Loss Optimization - Implement ATR-based dynamic stop-loss for better market volatility adaptation
- Timeframe Validation - Introduce multi-timeframe analysis to improve signal reliability
- Position Management Optimization - Dynamically adjust position size based on market volatility and signal strength
Summary
This strategy constructs a complete trading system through the comprehensive application of multiple technical analysis tools. Its strengths lie in multi-dimensional analysis and comprehensive risk management, while facing challenges such as false breakouts and parameter sensitivity. Through the suggested optimization directions, the strategy has the potential to further improve stability and adaptability while maintaining existing advantages. To successfully implement this strategy, traders need to deeply understand each component and make appropriate parameter adjustments based on actual market conditions.
/*backtest
start: 2025-02-12 00:00:00
end: 2025-02-19 00:00:00
period: 1h
basePeriod: 1h
exchanges: [{"eid":"Binance","currency":"TRUMP_USDT"}]
*/

//@version=5
strategy("Support/Resistance Strategy with Candlestick Confirmation, Market Structure, and 1:3 R:R", overlay=true)

// Input parameters
supportResistancePeriod = input.int(20, title="Support/Resistance Period", minval=1)
stopLossPips = input.int(50, title="Stop Loss (in pips)", minval=1)
takeProfitRatio = input.float(3.0, title="Risk-to-Reward Ratio", minval=1.0)
structurePeriod = input.int(20, title="Market Structure Period", minval=1)  // Period to determine market structure

// Function to calculate support level (lowest low in the period)
getSupportLevel() =>
    ta.lowest(low, supportResistancePeriod)

// Function to calculate resistance level (highest high in the period)
getResistanceLevel() =>
    ta.highest(high, supportResistancePeriod)

// Get the support and resistance levels
supportLevel = getSupportLevel()
resistanceLevel = getResistanceLevel()

// Function to detect market structure
isBullishTrend() =>
    high[structurePeriod] > high[structurePeriod+1] and low[structurePeriod] > low[structurePeriod+1]

isBearishTrend() =>
    high[structurePeriod] < high[structurePeriod+1] and low[structurePeriod] < low[structurePeriod+1]

isRanging() =>
    not isBullishTrend() and not isBearishTrend()

// Candlestick Pattern Detection Functions
isBullishEngulfing() =>
    close[1] < open[1] and close > open and close > open[1] and open < close[1]

isBearishEngulfing() =>
    close[1] > open[1] and close < open and close < open[1] and open > close[1]

isDoji() =>
    math.abs(close - open) <= (high - low) * 0.1

isHammer() =>
    body = math.abs(close - open)
    upperShadow = high - math.max(close, open)
    lowerShadow = math.min(close, open) - low
    body <= (high - low) * 0.3 and lowerShadow > body * 2 and upperShadow <= body * 0.5

isShootingStar() =>
    body = math.abs(close - open)
    upperShadow = high - math.max(close, open)
    lowerShadow = math.min(close, open) - low
    body <= (high - low) * 0.3 and upperShadow > body * 2 and lowerShadow <= body * 0.5

// Conditions for Buy and Sell based on candle close
buyCondition = (isBullishEngulfing() or isHammer()) and close > supportLevel
sellCondition = (isBearishEngulfing() or isShootingStar()) and close < resistanceLevel

// Define buy/sell conditions based on market structure
bullishMarket = isBullishTrend() and buyCondition
bearishMarket = isBearishTrend() and sellCondition
rangingMarket = isRanging() and (buyCondition or sellCondition)

// Calculate the Stop Loss and Take Profit Levels
longStopLoss = supportLevel - (stopLossPips * syminfo.mintick)
shortStopLoss = resistanceLevel + (stopLossPips * syminfo.mintick)

// Calculate R:R based Take Profit Levels
longTakeProfit = close + (math.abs(close - longStopLoss) * takeProfitRatio)
shortTakeProfit = close - (math.abs(close - shortStopLoss) * takeProfitRatio)

// Plotting Support and Resistance Lines
plot(supportLevel, color=color.green, linewidth=2, title="Support Level", style=plot.style_line)
plot(resistanceLevel, color=color.red, linewidth=2, title="Resistance Level", style=plot.style_line)

// Strategy: Buy on Support, Sell on Resistance with candlestick confirmation and market structure
if (bullishMarket)
    strategy.entry("Buy", strategy.long, stop=longStopLoss, limit=longTakeProfit)

if (bearishMarket)
    strategy.entry("Sell", strategy.short, stop=shortStopLoss, limit=shortTakeProfit)

if (rangingMarket)
    if (buyCondition)
        strategy.entry("Buy (Ranging)", strategy.long, stop=longStopLoss, limit=longTakeProfit)
    if (sellCondition)
        strategy.entry("Sell (Ranging)", strategy.short, stop=shortStopLoss, limit=shortTakeProfit)

// Optional: Highlighting the zones for support and resistance
bgcolor(close > resistanceLevel ? color.new(color.red, 90) : na, title="Resistance Zone")
bgcolor(close < supportLevel ? color.new(color.green, 90) : na, title="Support Zone")