
Overview
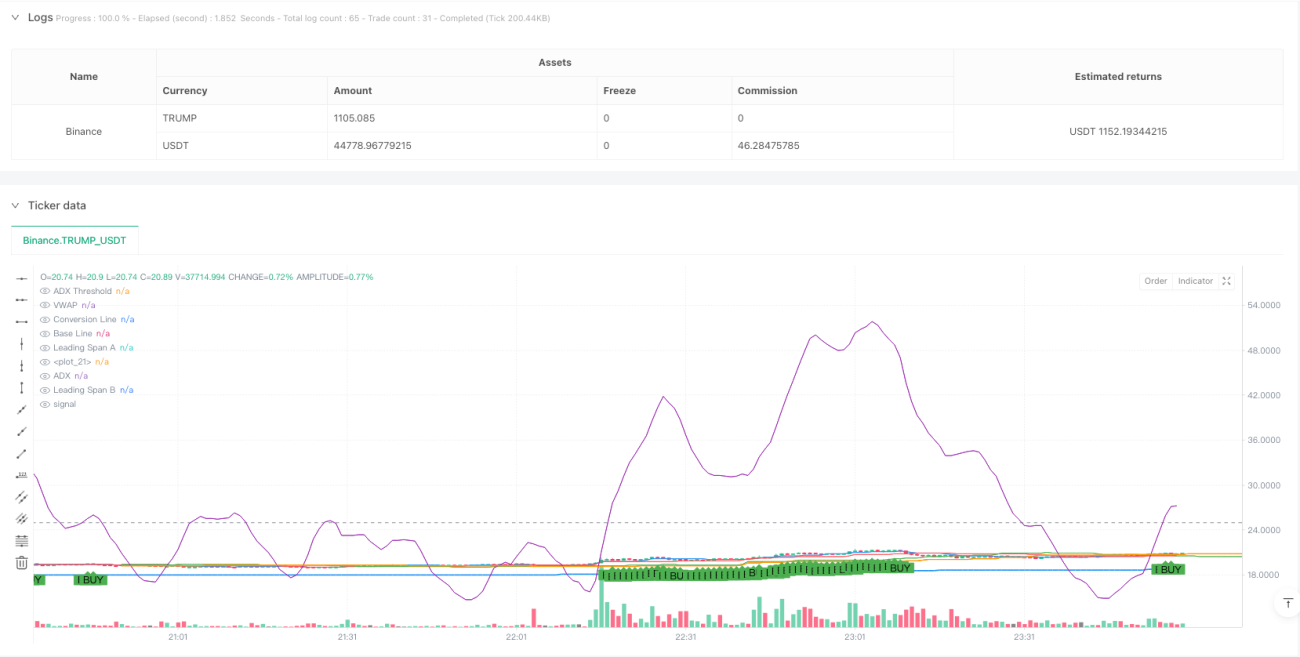
This strategy is a sophisticated trading system that combines multiple technical indicators, primarily utilizing the Ichimoku Cloud, Average Directional Index (ADX), and Volume Weighted Average Price (VWAP) to identify market trends, validate momentum strength, and confirm price positioning. The strategy employs multi-dimensional analysis to enhance trading accuracy and reliability, particularly suitable for medium to long-term trend trading.
Strategy Principles
The strategy employs a three-layer verification mechanism:
- Uses the Ichimoku Cloud system (including Conversion Line, Base Line, Leading Span A, and B) to determine market trend direction through price-cloud relationships.
- Employs the ADX indicator (14-period setting) to evaluate trend strength, with readings above 25 indicating strong trend development.
- Utilizes VWAP as dynamic support/resistance levels to confirm price positioning validity.
Trade Signal Generation:
Buy Signal: Price above both Leading Spans A and B + ADX>25 + Price above VWAP
Sell Signal: Price below both Leading Spans A and B + ADX>25 + Price below VWAP
Strategy Advantages
- Multi-dimensional verification significantly improves trading reliability, avoiding false signals from single indicators.
- Combines trend following and momentum analysis, capturing major trends while timing entries effectively.
- VWAP verification adds price rationality judgment, improving success rates.
- Strategy design includes robust protection mechanisms against market noise.
Strategy Risks
-
May generate frequent signals in ranging markets, increasing transaction costs.
Solution: Implement minimum holding period restrictions or add oscillator filters. -
Potential significant drawdowns during rapid market reversals.
Solution: Set appropriate stop-loss levels, consider using ATR for dynamic stop adjustment. -
Multiple conditions may cause missed trading opportunities.
Solution: Dynamically adjust parameters for different market conditions or use parameter combinations.
Strategy Optimization Directions
- Parameter Optimization: Backtest historical data to optimize indicator parameters for different market environments.
- Market Environment Recognition: Add volatility indicators (like ATR) to employ different parameter sets in varying volatility conditions.
- Risk Control Enhancement: Implement dynamic stop-loss mechanisms that adjust based on market volatility.
- Position Management Improvement: Include scaled entry and exit mechanisms to improve capital efficiency.
Summary
This strategy creates a comprehensive trading system by combining multiple proven technical indicators. The system incorporates core functionalities including trend identification, momentum confirmation, and price verification, while providing clear trading rules and risk control mechanisms. While there is room for optimization, it represents a logically sound and practical trading strategy.
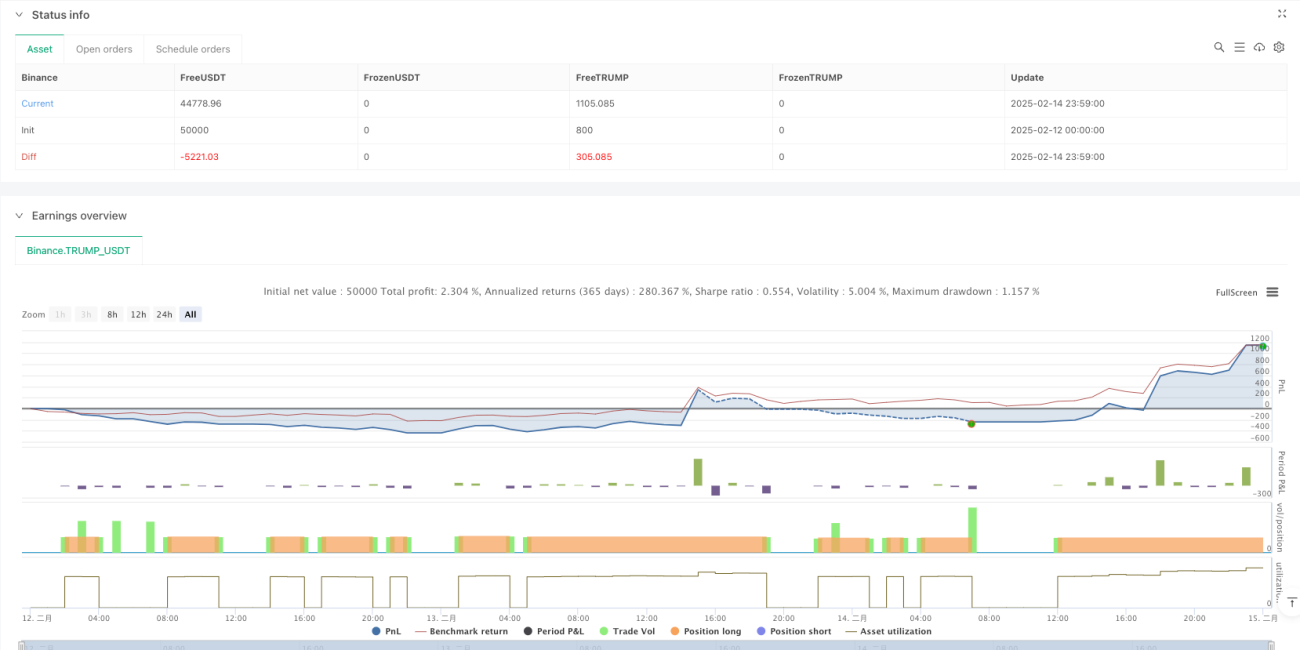
/*backtest
start: 2025-02-12 00:00:00
end: 2025-02-15 00:00:00
period: 1m
basePeriod: 1m
exchanges: [{"eid":"Binance","currency":"TRUMP_USDT"}]
*/

//@version=5
strategy("Ichimoku + ADX + VWAP Strategy", overlay=true, default_qty_type=strategy.percent_of_equity, default_qty_value=10)

// --- Ichimoku Cloud Parameters ---- 1