Gaussian Channel Trend Following with Stochastic RSI Trading Strategy

Overview
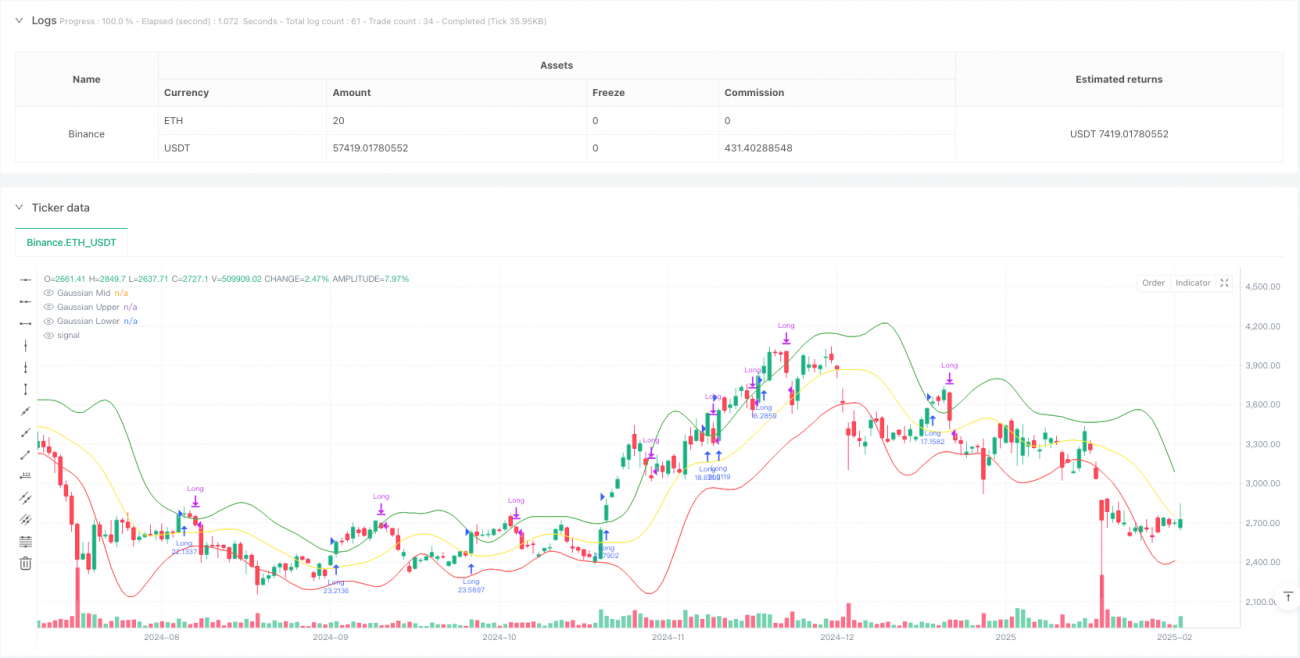
This strategy combines a Gaussian Weighted Moving Average Channel with the Stochastic Relative Strength Index (Stochastic RSI) to create a trend-following trading system. The strategy uses Gaussian weighting methods to construct a price channel and combines it with Stochastic RSI crossover signals to determine entry and exit points, effectively capturing trends and confirming momentum. The strategy has a solid mathematical foundation and effectively filters market noise while capturing major trends.
Strategy Principles
The core logic consists of two main components:
-
Gaussian Channel System: Uses Gaussian Weighted Moving Average (GWMA) and Gaussian Weighted Standard Deviation (GWSD) to construct a price channel. GWMA assigns higher weights to recent data, making the moving average more responsive to price changes. The channel bands are determined by multiplying the GWSD by a factor.
-
Stochastic RSI System: Applies stochastic calculations to the traditional RSI indicator to compute K and D values. This processing method better identifies overbought and oversold areas, providing more accurate momentum signals.
Trading signals are generated based on the following conditions:
- Long Entry: Price closes above the upper Gaussian channel band AND Stochastic RSI K-line crosses above D-line
- Exit Signal: Price closes below the upper Gaussian channel band
Strategy Advantages
- Solid Mathematical Foundation: Uses Gaussian weighting methods to construct price channels, providing better theoretical basis than simple moving averages.
- High Signal Reliability: Combines price breakout and momentum confirmation as dual verification mechanism, effectively reducing false signals.
- Strong Adaptability: Gaussian weighting method automatically adjusts channel width based on market volatility.
- Comprehensive Risk Control: Implements effective control over trading costs and risks through money management and commission settings.
Strategy Risks
- Trend Dependency: May generate frequent false signals in ranging markets, leading to overtrading.
- Lag Effect: Multiple moving average smoothing may result in delayed signals at trend turning points.
- Parameter Sensitivity: Strategy performance is highly dependent on parameter settings, requiring careful optimization.
Optimization Directions
- Market Environment Recognition: Add market state identification mechanism to use different parameter settings in different market conditions.
- Stop Loss Optimization: Introduce dynamic stop loss mechanism, such as ATR-based or volatility-based adaptive stops.
- Signal Filtering: Add volume confirmation or other technical indicators as auxiliary filtering conditions.
- Money Management: Implement more flexible position management strategies, adjusting position sizes dynamically based on signal strength.
Summary
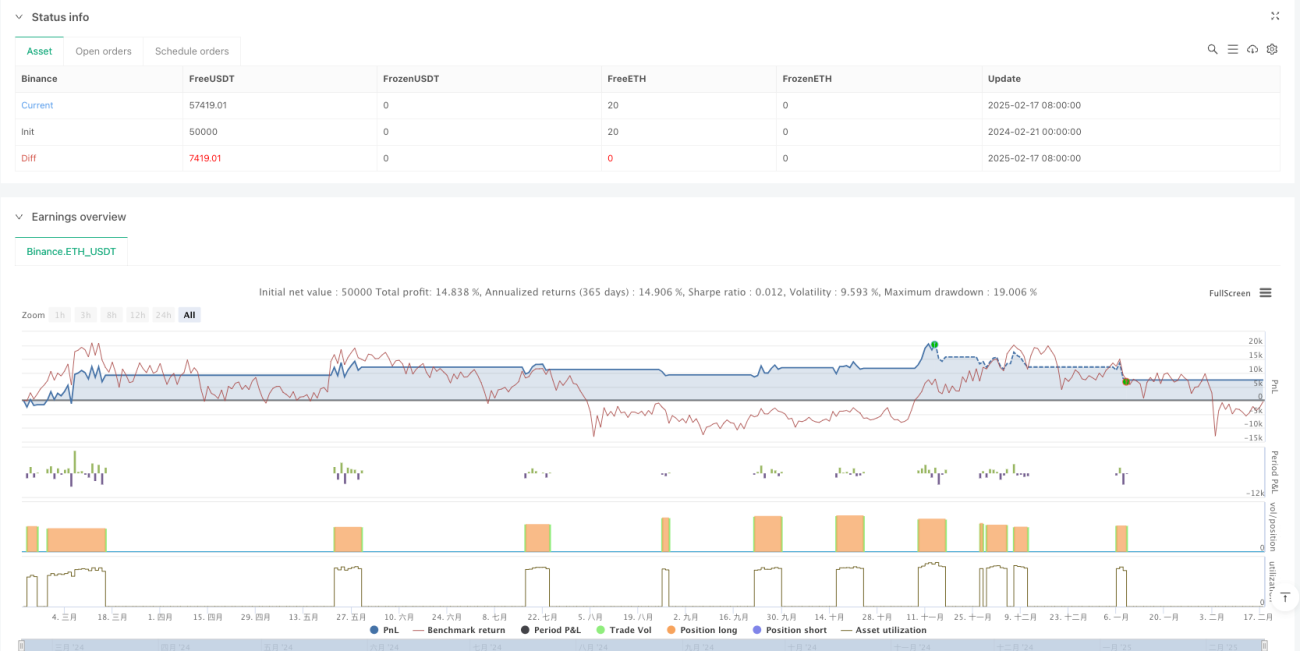
This strategy combines Gaussian channels and Stochastic RSI indicators to build a trend-following system with solid mathematical foundations. The strategy performs excellently in trending markets but requires attention to parameter optimization and market environment adaptability. Through implementing the suggested optimization measures, the strategy's stability and profitability can be further enhanced.
/*backtest
start: 2024-02-21 00:00:00
end: 2025-02-18 08:00:00
period: 1d
basePeriod: 1d
exchanges: [{"eid":"Binance","currency":"ETH_USDT"}]
*/

//@version=5
strategy("Gaussian Channel + Stoch RSI Strategy", overlay=true, margin_long=100, margin_short=100, initial_capital=100000, commission_type=strategy.commission.percent, commission_value=0.1, default_qty_type=strategy.percent_of_equity, default_qty_value=100, pyramiding=1)

// User Inputs- 1