Overview
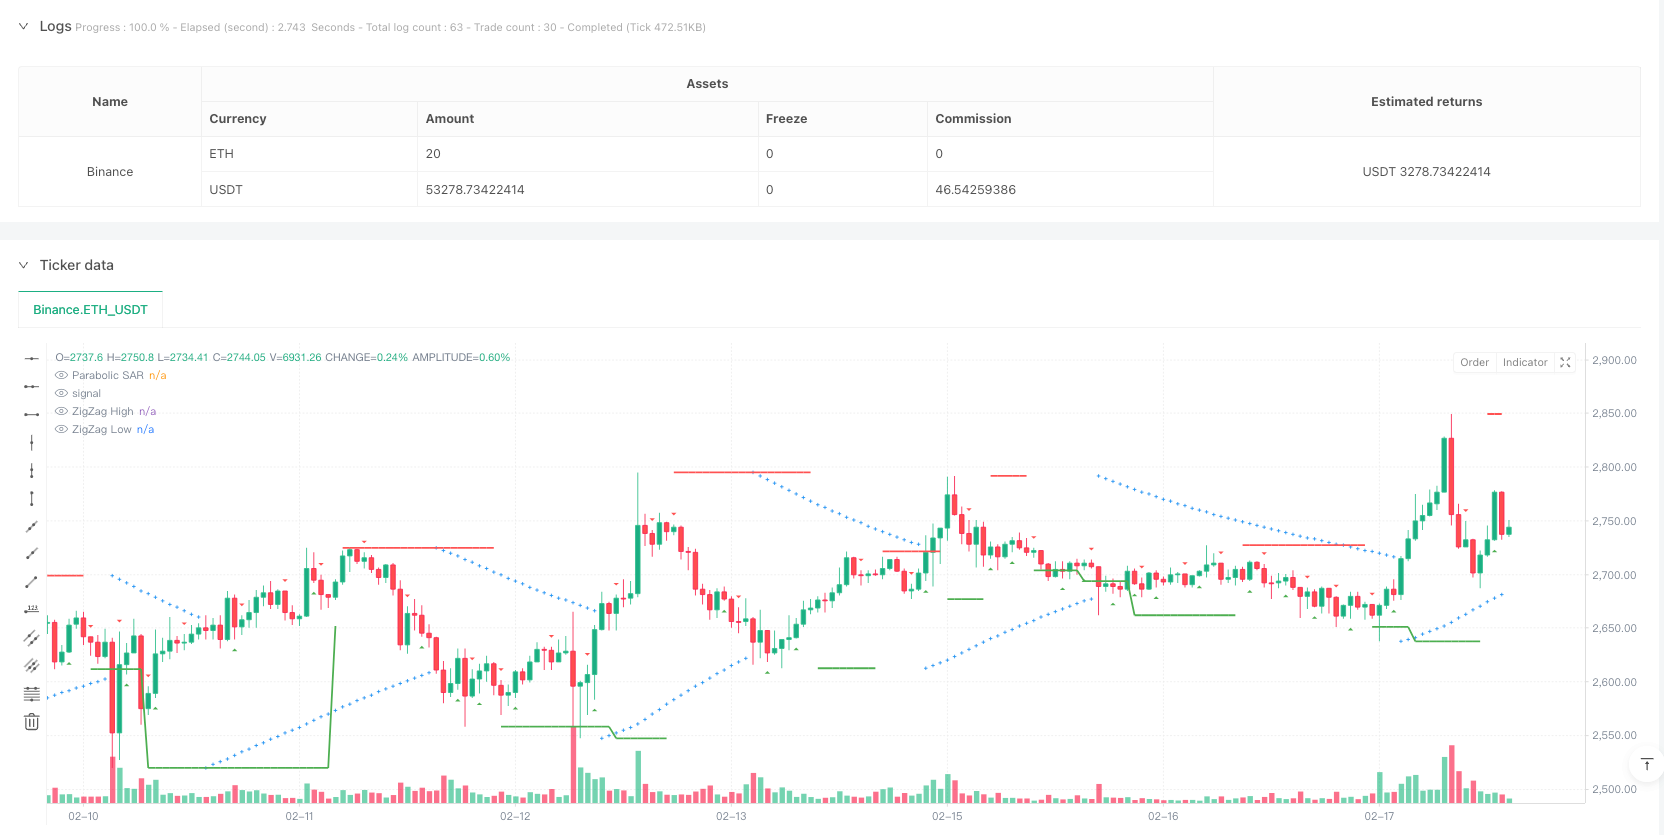
This strategy is a trend reversal trading system based on multiple technical indicators, combining ZigZag indicator, Fractals theory, and Parabolic SAR. The strategy captures trading opportunities during market trend changes through the coordination of these three indicators, controlling risk through strict entry and exit conditions.
Strategy Principles
The core principle operates through a triple verification mechanism to confirm trading signals: 1. ZigZag indicator identifies primary trend direction, filtering market noise through depth and deviation parameters. 2. Fractals indicator confirms potential reversal points by identifying local highs and lows. 3. Parabolic SAR serves as the final trigger signal, confirming entry timing when price crosses the SAR line.
Multiple verification trading conditions include: - Long conditions: Price crosses above SAR + ZigZag shows uptrend + Down fractal appears - Short conditions: Price crosses below SAR + ZigZag shows downtrend + Up fractal appears
Strategy Advantages
- High signal reliability: Significantly reduces false breakout signals through cross-validation of multiple technical indicators.
- Comprehensive risk control: Uses Parabolic SAR as dynamic stop-loss line for effective profit protection.
- Strong adaptability: Strategy parameters can be flexibly adjusted for different market conditions.
- Strong trend-following capability: Combines ZigZag and SAR’s dynamic characteristics for good returns in trending markets.
- Clear execution standards: Entry and exit conditions are well-defined for programmatic implementation.
Strategy Risks
- Choppy market risk: May generate frequent false signals in sideways markets.
- Parameter sensitivity: ZigZag and SAR parameter settings significantly impact strategy performance.
- Slippage risk: May face significant slippage losses in fast-moving markets.
- Signal lag: Multiple confirmation mechanism may lead to relatively delayed entry timing.
Strategy Optimization Directions
- Dynamic parameter optimization: Automatically adjust SAR and ZigZag parameters based on market volatility.
- Market environment filtering: Add trend strength indicators to automatically reduce position size or pause trading in sideways markets.
- Take-profit optimization: Introduce ATR indicator for dynamic profit targets.
- Fractal confirmation enhancement: Add volume fractal verification to improve signal reliability.
- Position management optimization: Dynamically adjust position sizes based on signal strength and market volatility.
Summary
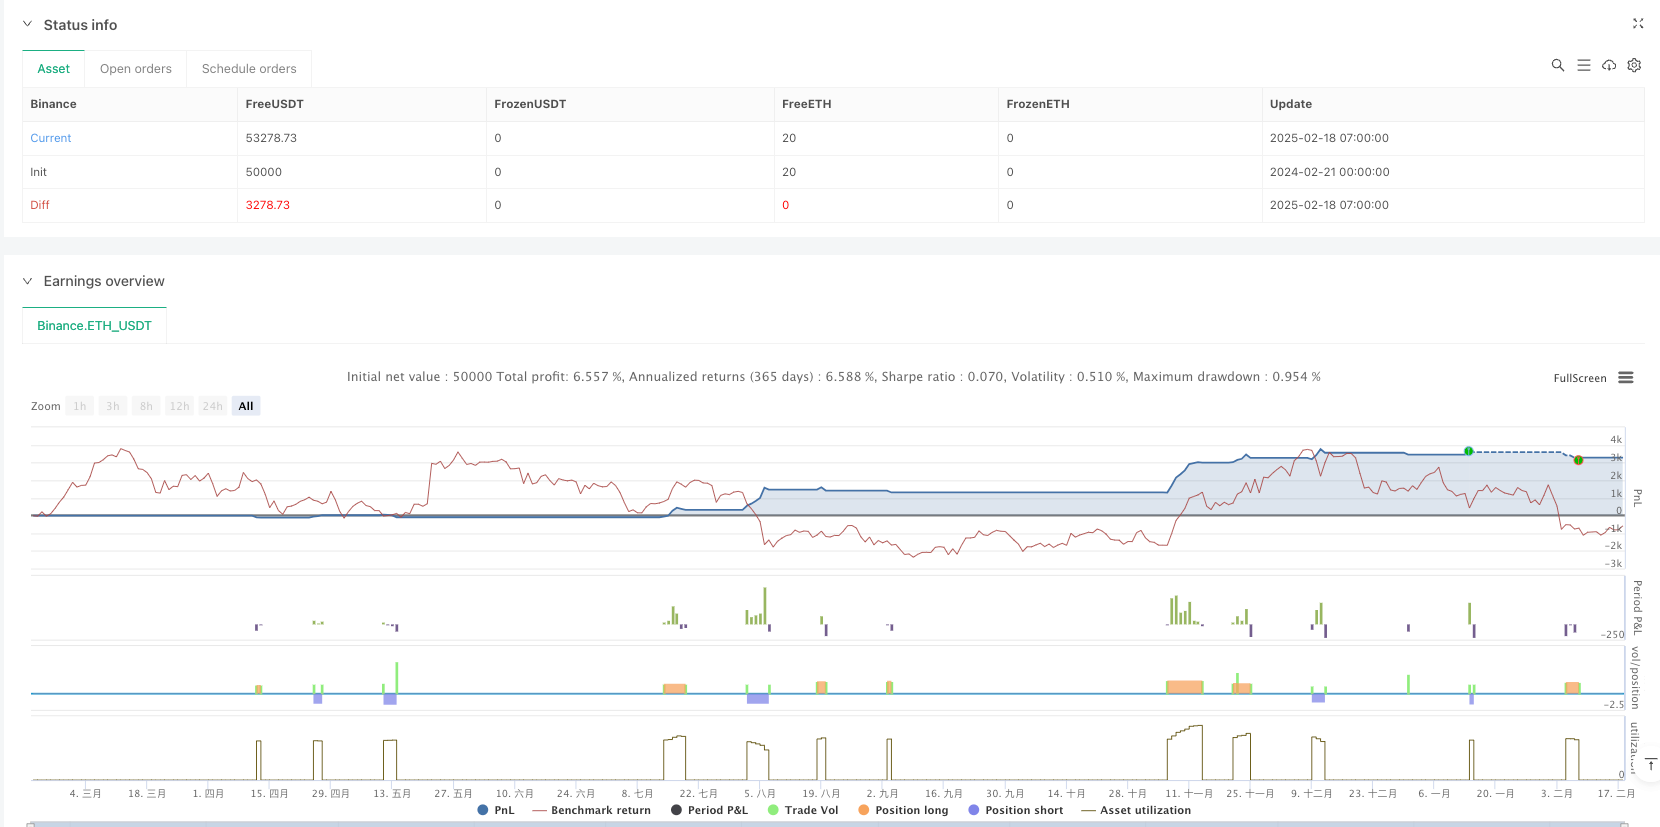
This strategy constructs a relatively complete trend reversal trading system through the comprehensive use of multiple technical indicators. Its main advantages lie in high signal reliability and comprehensive risk control, though attention must be paid to false signal risks in choppy markets. Through the proposed optimization directions, especially dynamic parameter adjustment and market environment filtering, the strategy’s stability and profitability can be further enhanced. In practical application, it is recommended to fully validate parameter settings through backtesting and implement targeted optimizations based on actual market conditions.
/*backtest
start: 2024-02-21 00:00:00
end: 2025-02-18 08:00:00
period: 1h
basePeriod: 1h
exchanges: [{"eid":"Binance","currency":"ETH_USDT"}]
*/

//@version=6
strategy("ZigZag + Fractals + SAR Crossover Stratégiia", overlay=true, default_qty_type=strategy.percent_of_equity, default_qty_value=10)

// Parametre ZigZag
zigzag_depth = input.int(5, title="ZigZag Hĺbka")
zigzag_deviation = input.float(5.0, title="ZigZag Odchýlka (%)") / 100

// Výpočet ZigZag
var float last_pivot = na
var bool is_uptrend = false  // Inicializované na false
zigzag_high = ta.pivothigh(high, zigzag_depth, zigzag_depth)
zigzag_low = ta.pivotlow(low, zigzag_depth, zigzag_depth)

if not na(zigzag_high)
    last_pivot := zigzag_high
    is_uptrend := false
if not na(zigzag_low)
    last_pivot := zigzag_low
    is_uptrend := true

// Fraktály
fractal_up = ta.pivothigh(high, 2, 2)
fractal_down = ta.pivotlow(low, 2, 2)

// Parabolic SAR
sar = ta.sar(0.02, 0.2, 0.02)

// Prechody Parabolic SAR a Cena
sar_cross_up = ta.crossover(sar, close)  // SAR prechádza nad cenu
sar_cross_down = ta.crossunder(sar, close)  // SAR prechádza pod cenu

// Obchodné podmienky založené na prechodoch
long_condition = sar_cross_down and is_uptrend and not na(fractal_down)
short_condition = sar_cross_up and not is_uptrend and not na(fractal_up)

// Vstupy do pozícií
if (long_condition)
    strategy.entry("Long", strategy.long)

if (short_condition)
    strategy.entry("Short", strategy.short)

// Výstupy z pozícií založené na prechodoch
if (sar_cross_up)
    strategy.close("Long")

if (sar_cross_down)
    strategy.close("Short")

// Vizualizácia indikátorov
plotshape(series=fractal_up, location=location.abovebar, color=color.red, style=shape.triangledown, title="Fraktál Hore")
plotshape(series=fractal_down, location=location.belowbar, color=color.green, style=shape.triangleup, title="Fraktál Dole")
plot(sar, style=plot.style_cross, color=color.blue, title="Parabolic SAR")

// Vizualizácia ZigZag
plot(is_uptrend ? last_pivot : na, title="ZigZag Low", color=color.green, linewidth=2, style=plot.style_linebr)
plot(not is_uptrend ? last_pivot : na, title="ZigZag High", color=color.red, linewidth=2, style=plot.style_linebr)