Dual Moving Average Trend Crossover Quantitative Trading Strategy Analysis and Optimization

Overview
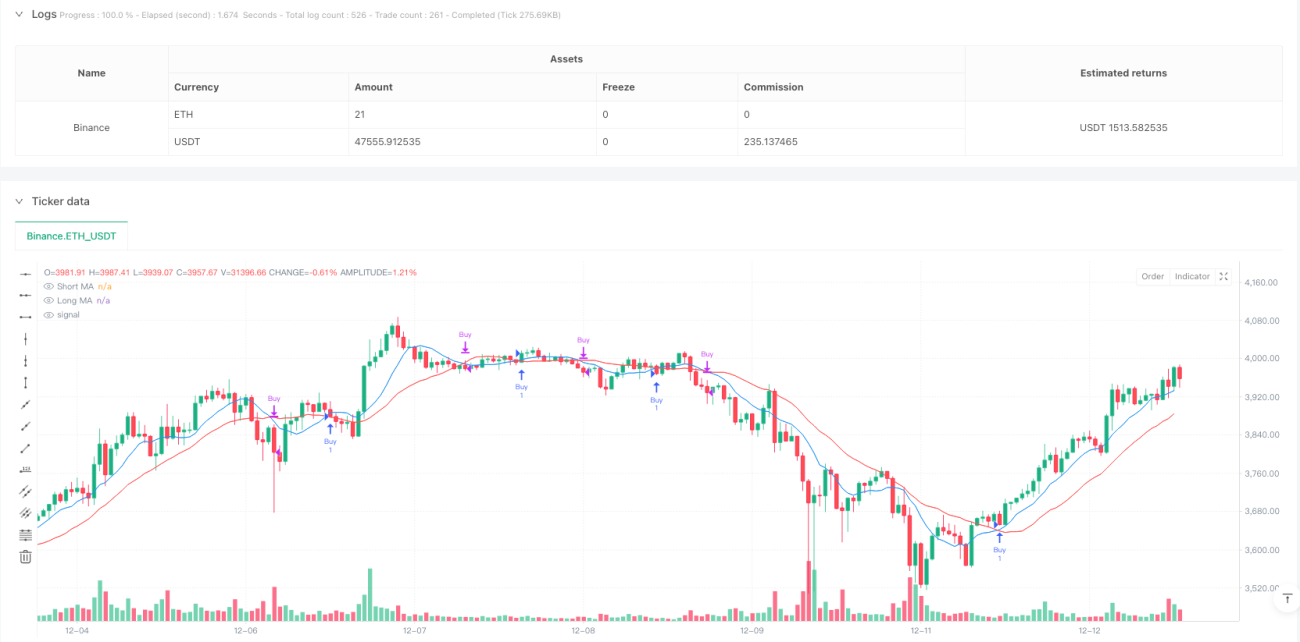
This strategy is a trend-following trading system based on dual moving average crossovers. By comparing the relative positions of short-term and long-term moving averages (9-day and 21-day respectively), it captures market trend reversal opportunities. The strategy combines classical technical analysis theory with modern quantitative trading methods to achieve fully automated trading decisions.
Strategy Principle
The core logic relies on crossover signals between two moving averages of different periods. When the short-term MA (9-day) crosses above the long-term MA (21-day), the system identifies upward momentum and triggers a long position; when the short-term MA crosses below the long-term MA, the system recognizes downward momentum and closes the position. Additionally, the strategy includes trade statistics functionality that tracks total trades, winning trades, and losing trades in real-time to help traders evaluate strategy performance.
Strategy Advantages
- Simple and clear logic, easy to understand and maintain
- Purely price-based, requiring no complex indicators
- Built-in trend-following capability, effective for capturing medium to long-term trends
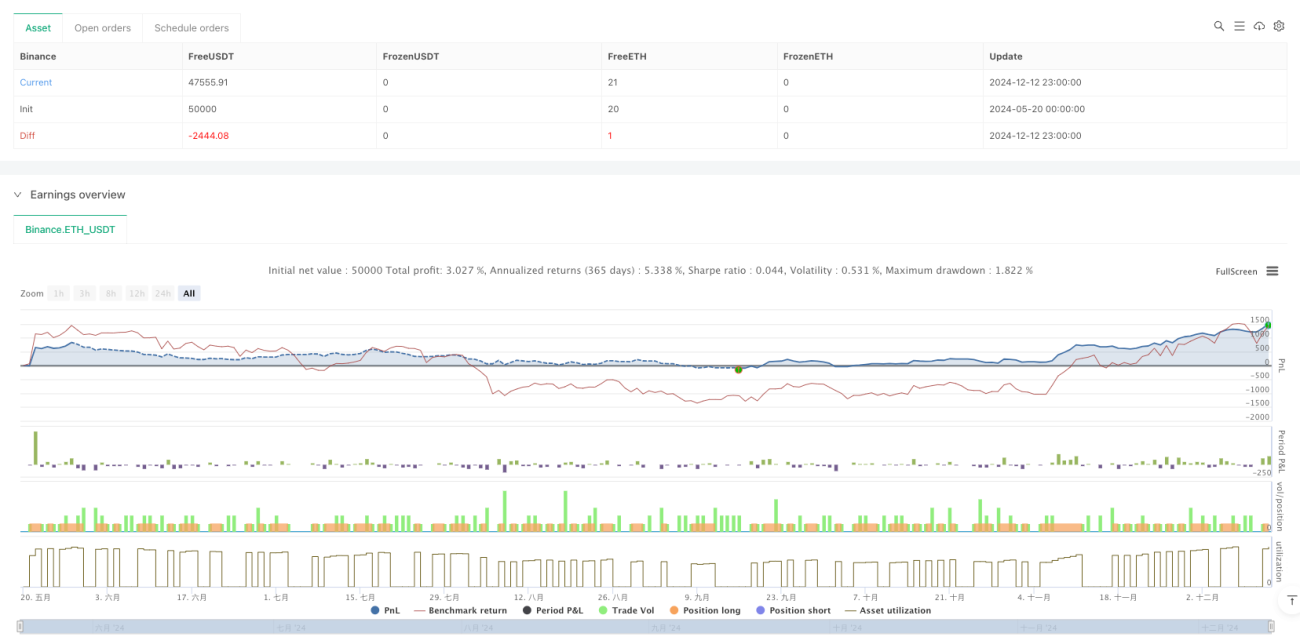
- Complete trade statistics system for strategy evaluation
- Fully automated operation, reducing emotional interference
Strategy Risks
- Frequent false signals in ranging markets
- Slight lag in entry and exit timing
- Absence of stop-loss mechanism, potential for significant losses during volatile periods
- Reliance solely on moving averages, lacking multi-dimensional market analysis
- Fixed parameters, difficult to adapt to different market conditions
Strategy Optimization Directions
- Implement adaptive moving average periods to improve market environment adaptability
- Add volatility filters to reduce false signals in ranging markets
- Design dynamic stop-loss mechanisms to control downside risk
- Incorporate additional technical indicators like RSI or MACD to enhance signal reliability
- Develop market environment recognition modules for intelligent parameter adjustment
Summary
This is a classic and practical trend-following strategy that captures market momentum changes through dual moving average crossovers. While it has certain limitations in terms of lag and false signals, its simplicity and robustness make it an important tool in quantitative trading. Through the proposed optimization directions, the strategy's stability and profitability can be further enhanced.
- 1