Multi-Exponential Moving Average Golden Cross Trend Following Strategy

Overview
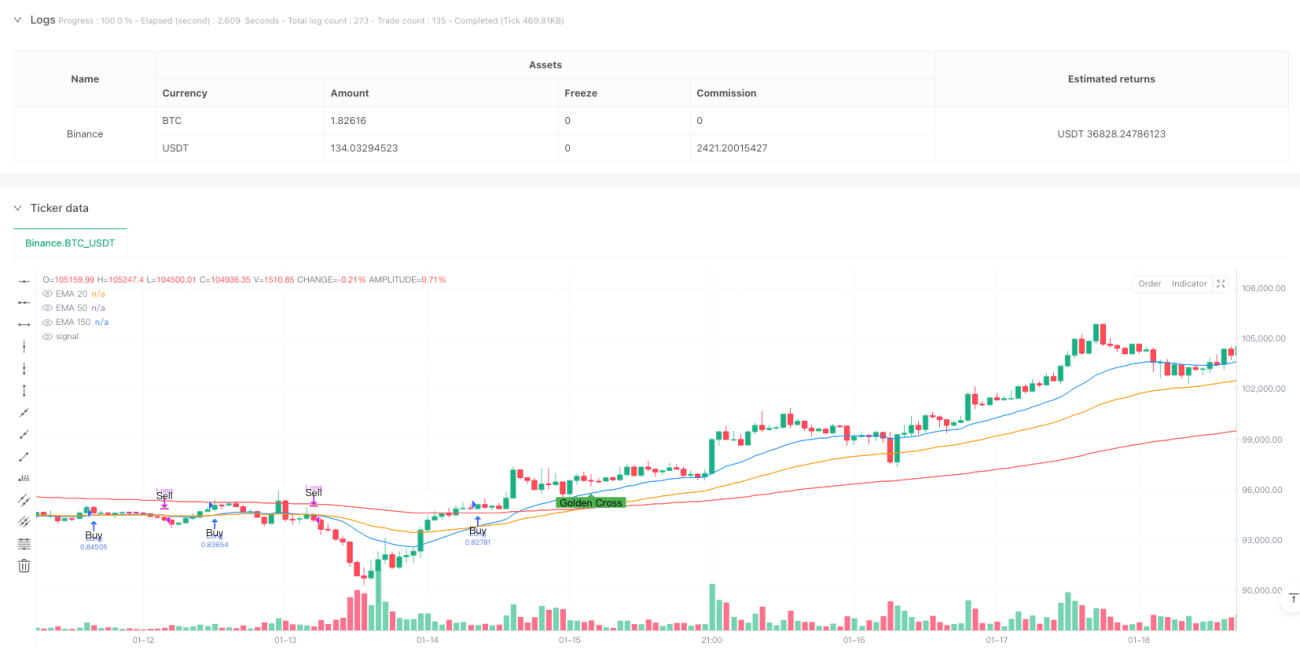
This strategy is a trend following system based on multiple Exponential Moving Average (EMA) crossover signals. By combining EMAs of 20, 50, and 150 periods, it creates a comprehensive framework for trend identification and trade execution. The strategy utilizes crossover relationships between different period EMAs to determine market trend changes and specific trading opportunities.
Strategy Principle
The strategy employs three EMAs of different periods: EMA20 for short-term trend, EMA50 for medium-term trend, and EMA150 for long-term trend. A golden cross forms when EMA50 crosses above EMA150, indicating a long-term uptrend formation; a death cross forms when EMA50 crosses below EMA150, indicating a long-term downtrend formation. Specific trading signals are generated by EMA20 and EMA50 crossovers: buy signals when EMA20 crosses above EMA50, and sell signals when EMA20 crosses below EMA50.
Strategy Advantages
- Strong Signal Stability: Multiple moving average filters effectively reduce false signals.
- Accurate Trend Capture: Combines short, medium, and long-term trends for more precise market direction judgment.
- Comprehensive Risk Control: Timely position closure based on trend reversal prevents significant drawdowns.
- Large Parameter Optimization Space: Moving average periods can be adjusted according to different market characteristics.
- Clear Execution Logic: Trading rules are simple and straightforward, easy to understand and execute.
Strategy Risks
- Trend Reversal Lag: Moving averages are inherently lagging indicators, potentially causing losses at trend turning points.
- Poor Performance in Ranging Markets: Frequent crossovers in sideways markets may lead to overtrading.
- Parameter Sensitivity: Choice of different period parameters significantly affects strategy performance.
- Market Adaptability: Strategy performs well in strong trend markets but may underperform in other market conditions.
Strategy Optimization Directions
- Add Trend Strength Filtering: Introduce trend strength indicators like ADX to filter trading signals in weak trend environments.
- Optimize Stop Loss Mechanism: Design dynamic stop loss solutions, such as ATR-based volatility stops.
- Incorporate Volatility Adaptation: Dynamically adjust EMA parameters based on market volatility to improve strategy adaptability.
- Enhance Position Management: Design dynamic position management system based on trend strength.
- Add Market Environment Assessment: Combine volume, volatility, and other indicators to judge market conditions and selectively activate strategy.
Summary
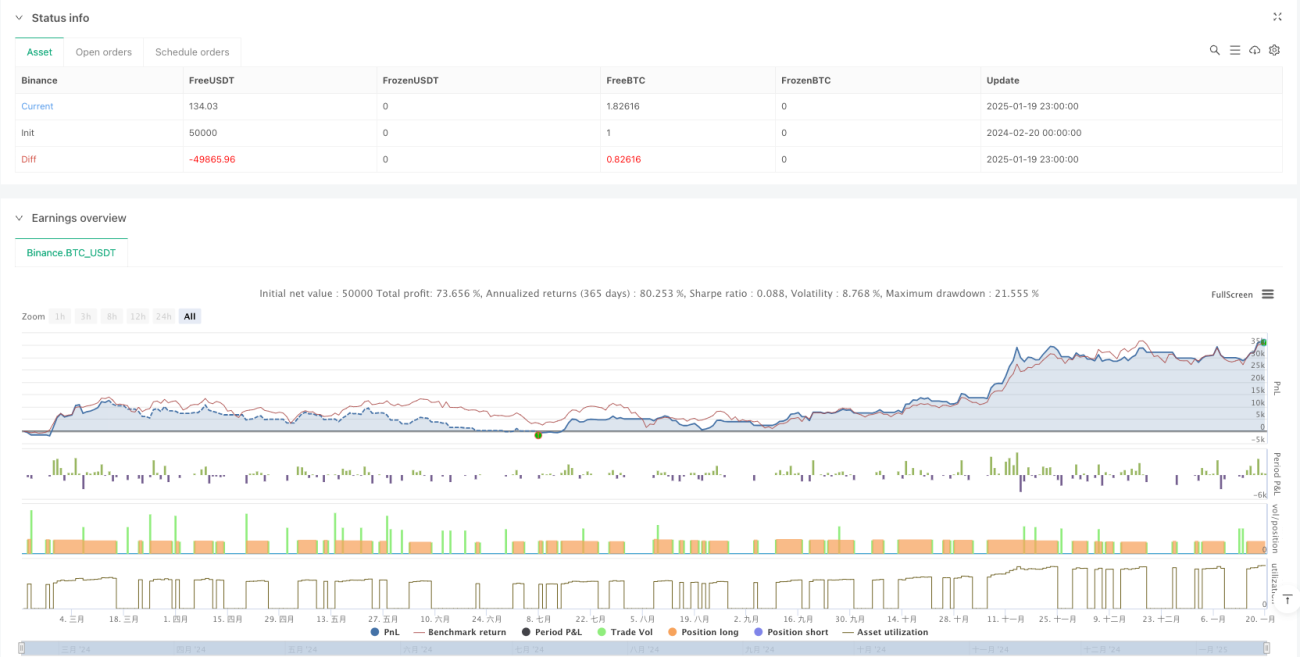
This strategy constructs a complete trend following trading system through the coordinated use of multiple exponential moving averages. The strategy logic is clear, implementation is simple, and it has good scalability. Through the suggested optimization directions, the strategy's stability and adaptability can be further enhanced. The strategy is suitable for tracking medium to long-term trends, but attention must be paid to market environment selection and risk control when using it.
/*backtest
start: 2024-02-20 00:00:00
end: 2025-01-20 00:00:00
period: 1h
basePeriod: 1h
exchanges: [{"eid":"Binance","currency":"BTC_USDT"}]
*/

//@version=6
strategy("EMA2050150 Crossover Strategy#ganges", overlay=true, default_qty_type=strategy.percent_of_equity, default_qty_value=100, commission_value=0.1, slippage=3)
- 1