Overview
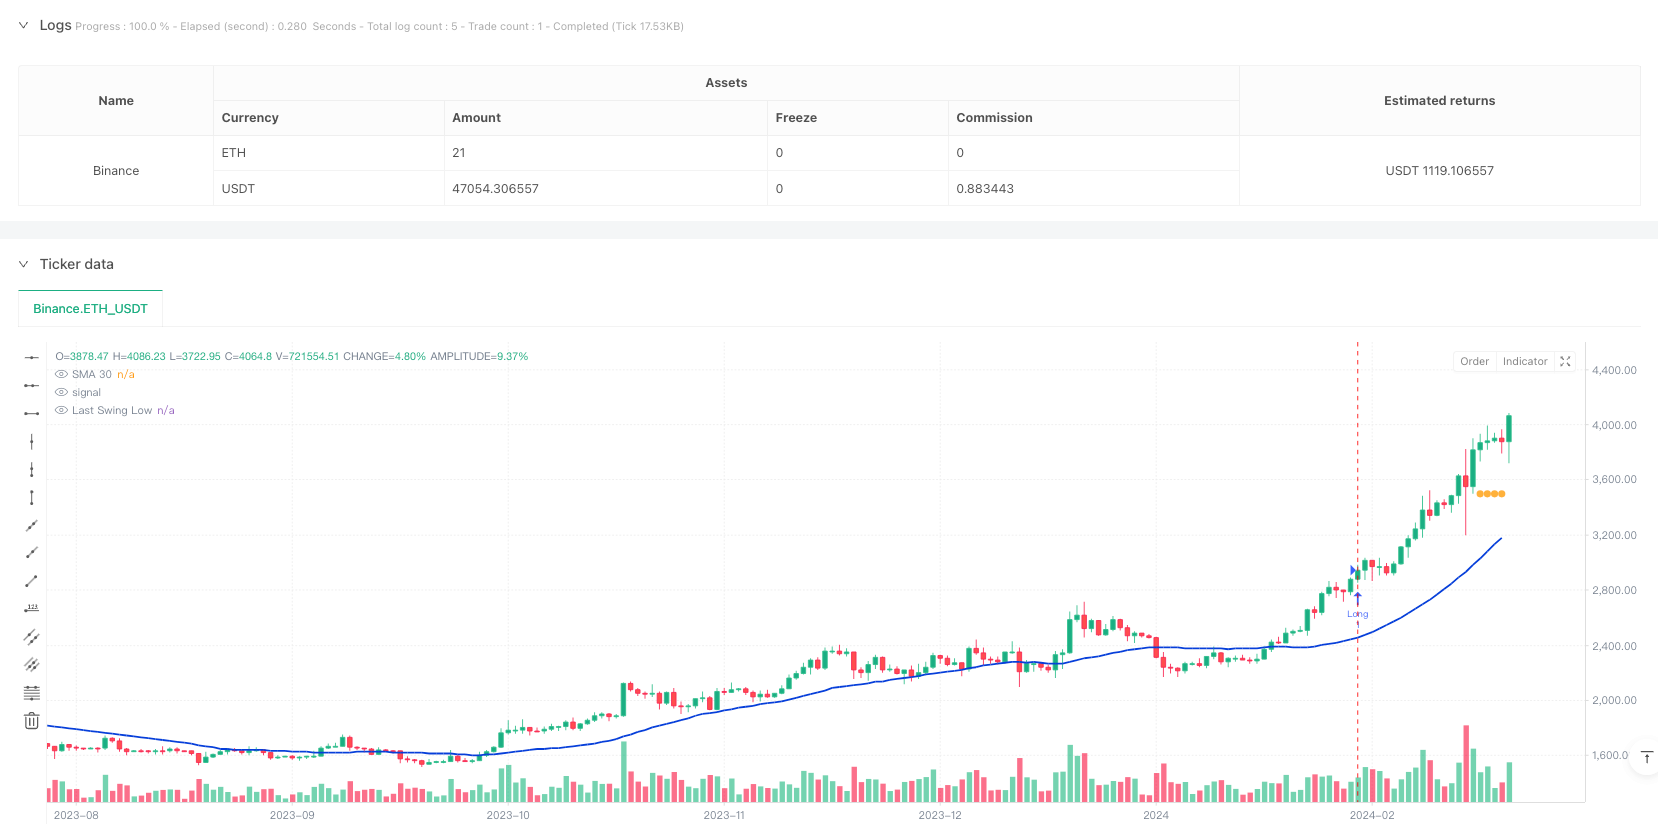
This is a trend-following strategy that combines multiple technical indicators, primarily utilizing SMA (Simple Moving Average), MACD (Moving Average Convergence Divergence), and ADX (Average Directional Index) for trading on weekly charts. The strategy employs a dynamic stop-loss mechanism through Swing Low identification to optimize risk management and achieve more precise position control.
Strategy Principles
The core logic is based on a triple verification mechanism: 1. Using SMA(30) to determine overall trend direction, with price above the moving average indicating an uptrend 2. Employing MACD(9,18,9) to capture price momentum, requiring MACD line above signal line and positive 3. Utilizing ADX(14) to confirm trend strength, with ADX above 25 indicating sufficient trend 4. Entering long positions when all three conditions are met 5. Setting dynamic stop-loss through second-lowest swing point identification, closing positions when price breaks below SMA
Strategy Advantages
- Multiple indicator cross-validation significantly reduces false signals
- Weekly timeframe trading avoids daily noise
- Dynamic stop-loss mechanism adapts to market conditions through swing low points
- ADX filtering removes weak trends, improving trade quality
- Comprehensive risk management with both trend reversal and stop-loss protection
Strategy Risks
- Multiple indicators may lead to delayed signals in fast-moving markets
- Weekly timeframe operations may face larger drawdowns
- Swing low identification may become unstable in volatile conditions
- Requires substantial historical data for reliable operation
- May generate frequent false signals in ranging markets
Strategy Optimization Directions
- Consider implementing adaptive indicator parameters based on market volatility
- Add volume indicator verification to improve signal reliability
- Develop more sophisticated Swing Low identification algorithms
- Incorporate market environment classification with different parameters for different market states
- Optimize stop-loss logic by introducing trailing stops
Summary
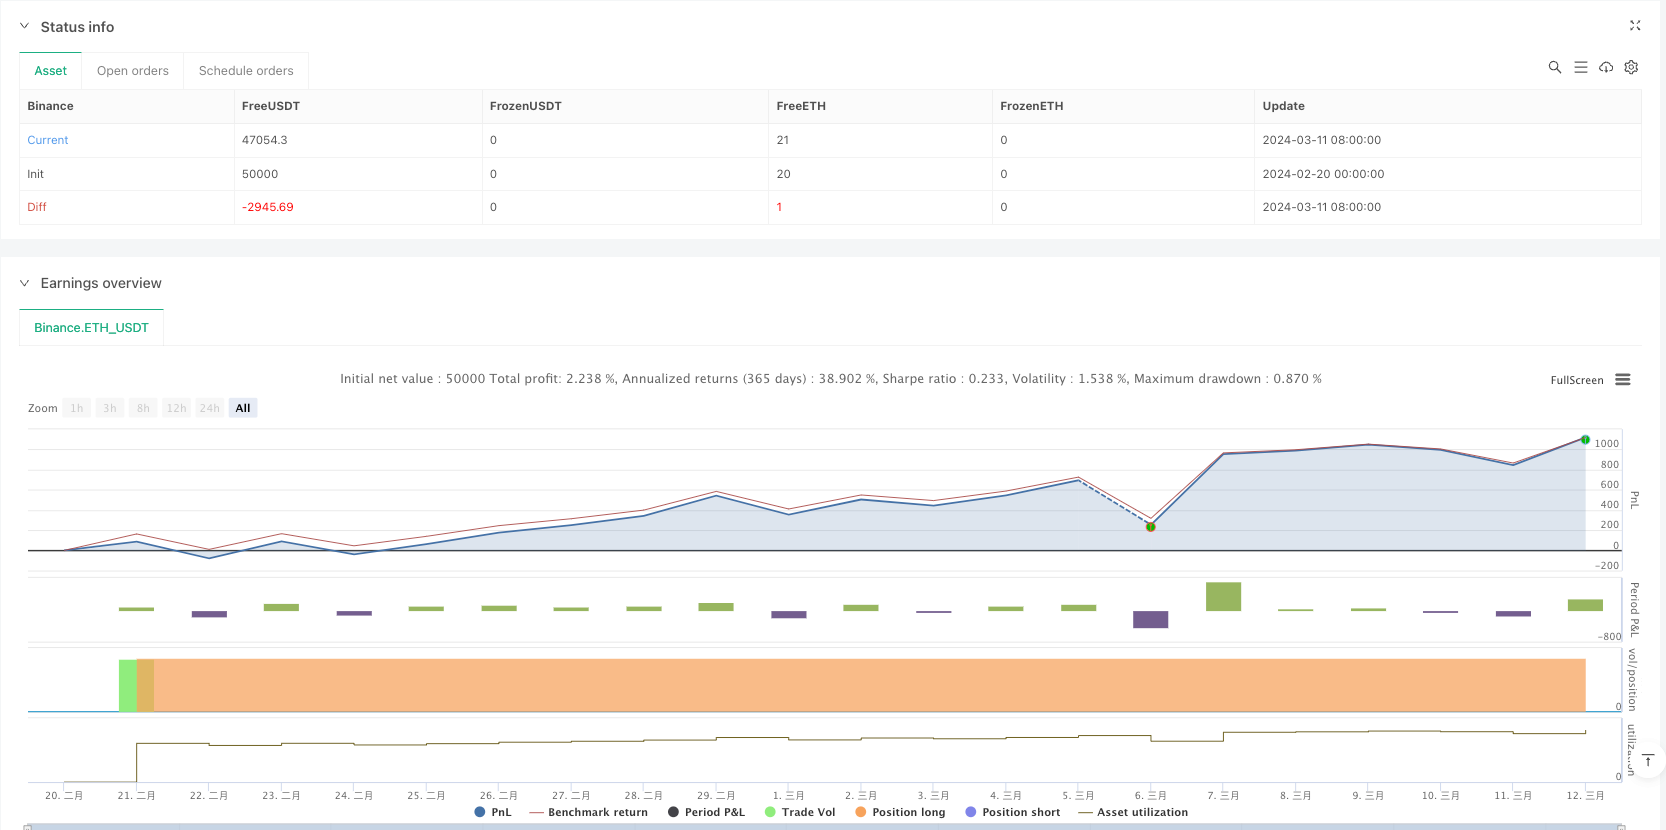
This strategy builds a robust trend-following system through the synergy of multiple technical indicators. The dynamic stop-loss mechanism provides effective risk control, suitable for tracking medium to long-term trends. While the strategy’s main strengths lie in high signal reliability and comprehensive risk management, it faces challenges such as signal lag. Further optimization in parameter adaptivity and market environment recognition could potentially enhance its performance.
/*backtest
start: 2024-02-20 00:00:00
end: 2024-03-12 00:00:00
period: 1d
basePeriod: 1d
exchanges: [{"eid":"Binance","currency":"ETH_USDT"}]
*/

//@version=5
strategy("Invest SMA|MACD|ADX Long Weekly Strategy (BtTL)", overlay=true)

// SMA Inputs
smaLength = input.int(30, title="SMA Länge")
// MACD Inputs
macdFastLength = input.int(9, title="MACD schnelle Periode")
macdSlowLength = input.int(18, title="MACD langsame Perside")
macdSignalLength = input.int(9, title="MACD Signal Smoothing")
//ADX Inputs
adxlen = input(14, title="ADX Smoothing")
dilen = input(14, title="DI Länge")

// SMA-Berechnung
smaValue = ta.sma(close, smaLength)
isAboveSMA = close > smaValue
isBelowSMA = close < smaValue

// MACD-Berechnung
[macdLine, signalLine, _] = ta.macd(close, macdFastLength, macdSlowLength, macdSignalLength)
isMACDBuy = macdLine > signalLine and macdLine > 0

// Swing-Low Berechnung (5-Kerzen)
isSwingLow = low[2] > low[1] and low[3] > low[1] and low[1] < low and low[1] < low[4]
var float lastSwingLow = na
var float secondLastSwingLow = na

// Wenn ein neuer Swing-Low gefunden wird
if (isSwingLow[1])
    secondLastSwingLow := lastSwingLow
    lastSwingLow := low[1]

//ADX ermitteln
[pDI,mDI,ADX] = ta.dmi(dilen, adxlen)
IsInTrend = ADX > 25

// Einstiegskondition mit MACD und SMA
longCondition = isAboveSMA and isMACDBuy and IsInTrend
if (longCondition)
    strategy.entry("Long", strategy.long)

// Ausstiegskondition am vorletzten Swing-Low
if (isBelowSMA and na(secondLastSwingLow) == false)
    strategy.exit("Exit", from_entry="Long", stop=secondLastSwingLow)

// Reset bei Position schließen
if(strategy.position_size <= 0)
    secondLastSwingLow := na
    lastSwingLow := na

// Plots
plot(smaValue, title="SMA 30", color=#063eda, linewidth=2)
plot(na(lastSwingLow) ? na : lastSwingLow, title="Last Swing Low", color=#ffb13b, linewidth=1, style=plot.style_circles)
plot(na(secondLastSwingLow) ? na : secondLastSwingLow, title="Second Last Swing Low", color=color.red, linewidth=1, style=plot.style_circles)