Multi-Period Trend Following with Volume Confirmation Strategy

2
Follow
478
Followers
Overview
This strategy is a trend-following system that combines multi-period moving averages with volume analysis. It uses daily EMA9, WMA20, and WMA200 to confirm overall trends, while incorporating OBV (On Balance Volume) indicator and its EMA for volume confirmation, achieving more robust trend-following trading.
Strategy Principles
The strategy operates based on two core conditions:
- Trend Confirmation - Determines trend direction by checking if three daily moving averages (EMA9, WMA20, WMA200) are all in upward trends. When all three moving averages are sloping upward, it indicates bullish trends across different time periods.
- Volume Confirmation - Uses OBV indicator and its 13-period EMA for volume analysis. When OBV's EMA is above OBV, it confirms the trend's validity through volume support.
The strategy generates long signals only when both conditions are met simultaneously. Positions are closed when either condition fails.
Strategy Advantages
- Multi-timeframe Analysis - Reduces false breakout risks by considering short-term (EMA9), medium-term (WMA20), and long-term (WMA200) trends.
- Volume Support - Incorporates OBV indicator analysis to ensure price movements are supported by volume.
- Comprehensive Risk Control - Implements percentage-based position management and considers commission costs, better reflecting real trading conditions.
- Visual Support - Helps traders understand entry and exit timing through clear graphical markers.
Strategy Risks
- Trend Reversal Lag - May respond slowly to trend reversals due to multiple moving average confirmations.
- Ineffective in Ranging Markets - Frequent false breakouts during consolidation phases may lead to excessive trading.
- Capital Cost Consideration - 0.1% commission may significantly impact returns in high-frequency trading.
Strategy Optimization Directions
- Incorporate Volatility Indicators - Consider adding ATR or similar indicators for dynamic position sizing in different market conditions.
- Improve Stop Loss Mechanism - Recommend adding trailing stop loss functionality for better profit protection.
- Market Environment Filtering - Add market environment assessment indicators to reduce trading frequency or pause trading during ranging markets.
- Optimize Parameters - Consider optimizing moving average periods and OBV parameters for different markets and instruments.
Summary
This strategy builds a relatively complete trend-following system by combining multi-period trend analysis with volume confirmation. The strategy logic is clear and risk control is reasonable, though there remains room for optimization. Traders are advised to test carefully in live trading and adjust parameters according to specific market characteristics.
Source
Pine
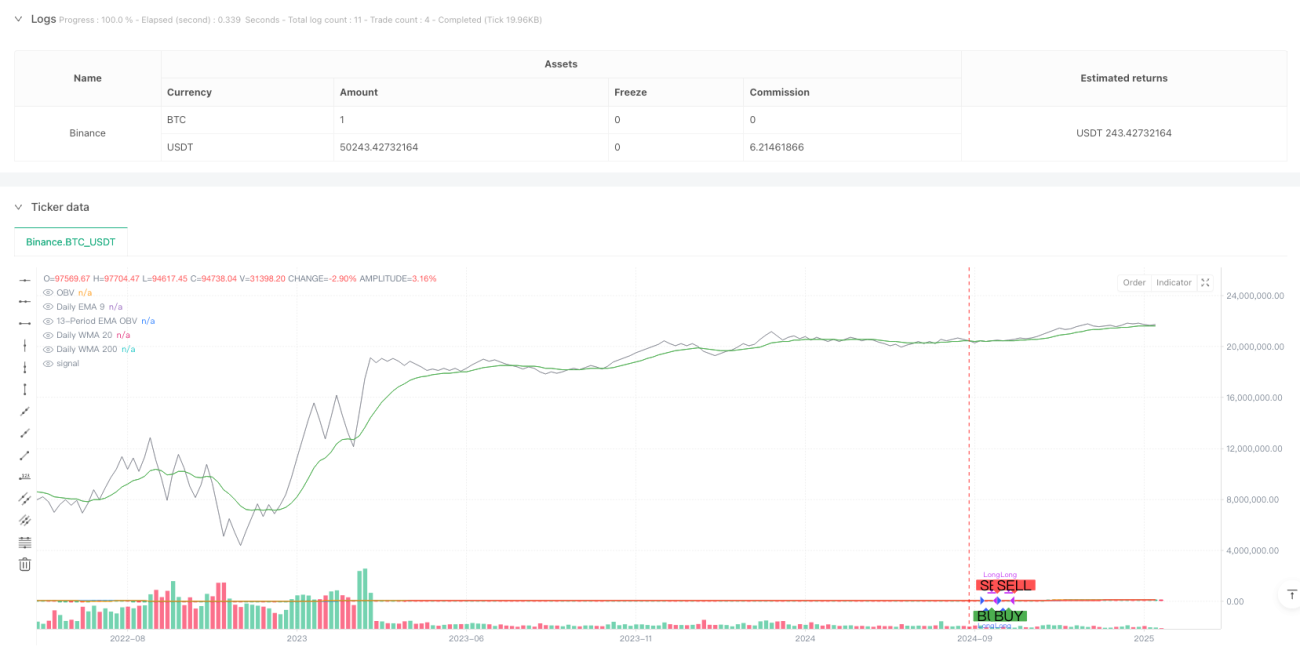
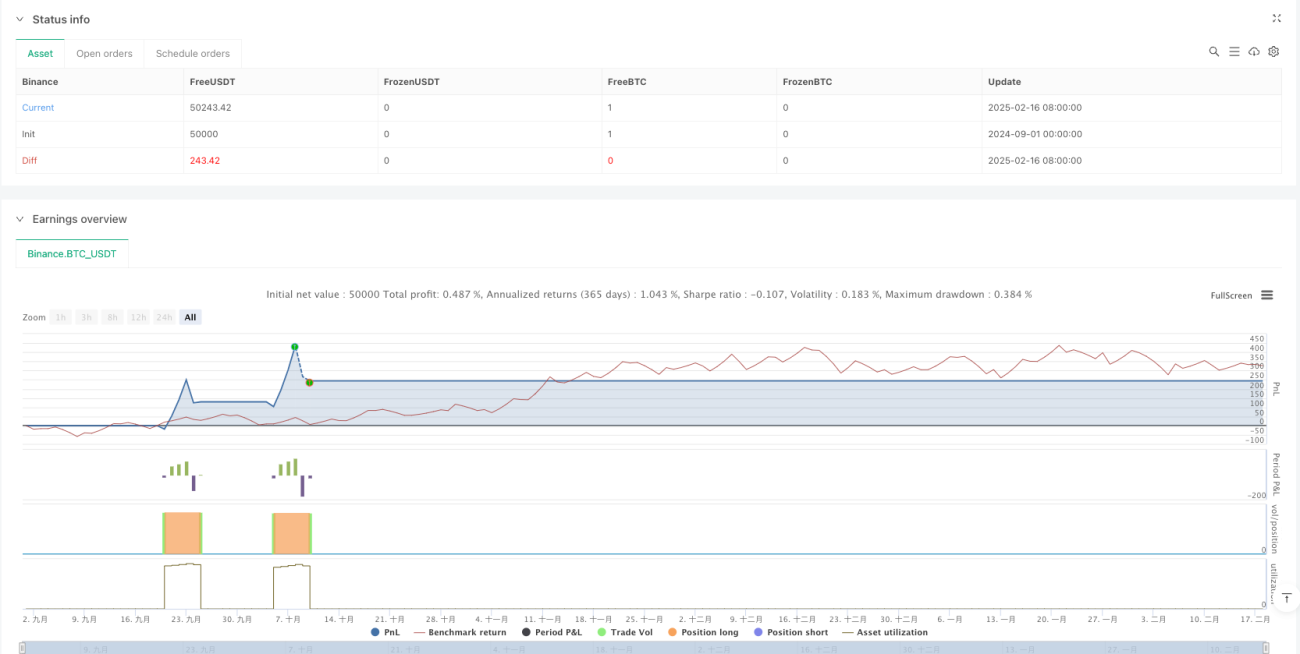
/*backtest
start: 2024-09-01 00:00:00
end: 2025-02-18 08:00:00
period: 5d
basePeriod: 5d
exchanges: [{"eid":"Binance","currency":"BTC_USDT"}]
*/

//@version=6
strategy("Strategy: Daily MAs + OBV", overlay=true, initial_capital=10000, default_qty_type=strategy.percent_of_equity, default_qty_value=10, commission_type=strategy.commission.percent, commission_value=0.1)

//=== Daily Moving Averages Calculation =========================Related strategies
Comment
All comments (0)
No data
- 1