Price Range and Breakout Based Efficient Quantitative Trading Strategy
Pivot CONSOLIDATION ZONE BREAKOUT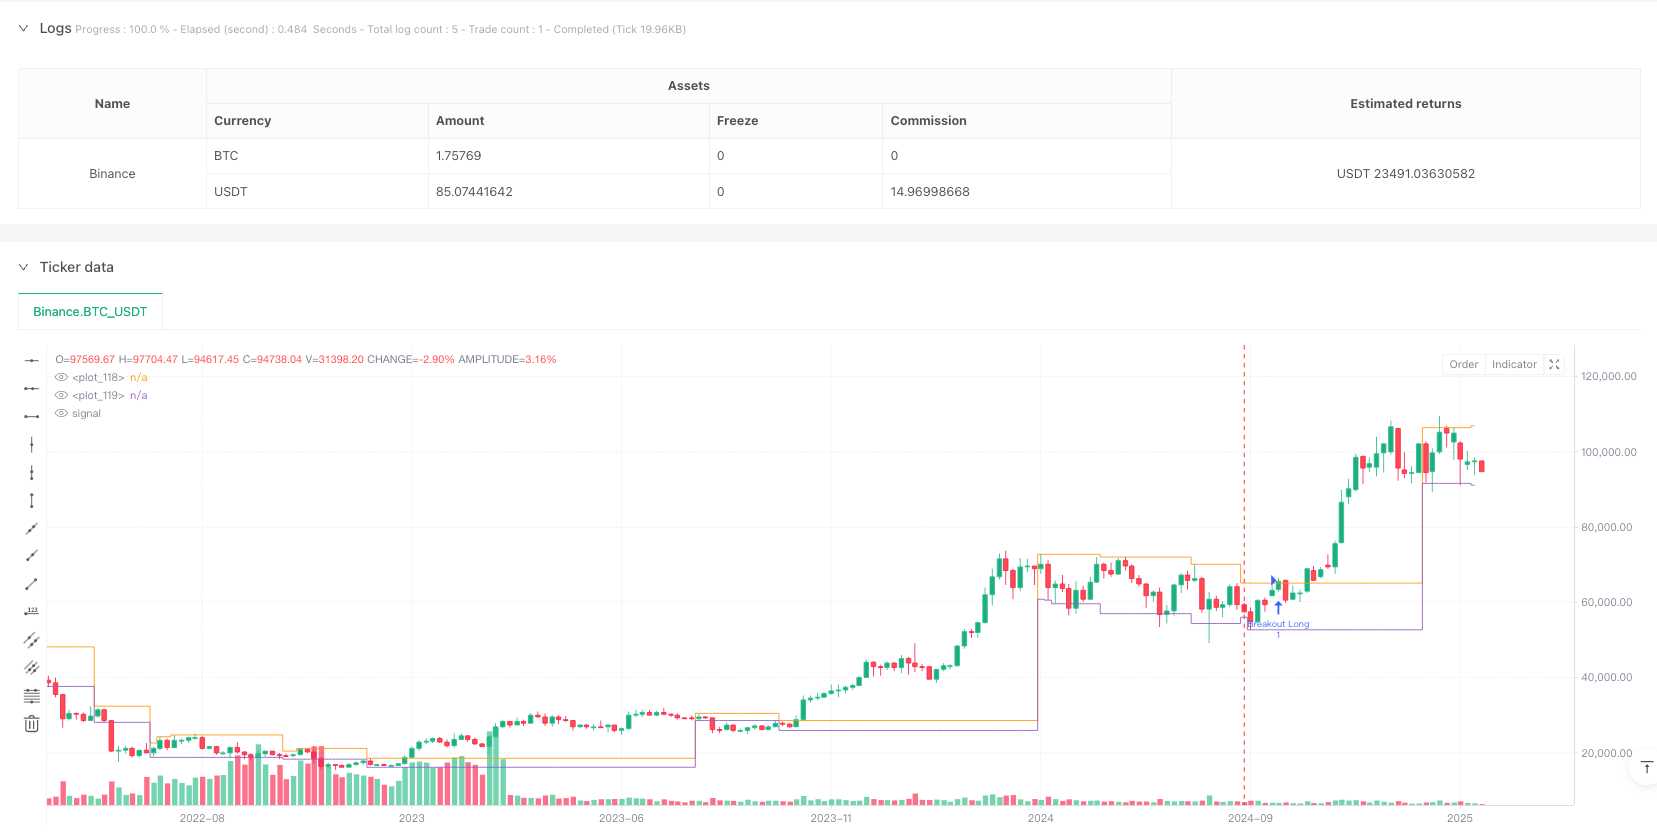
Overview
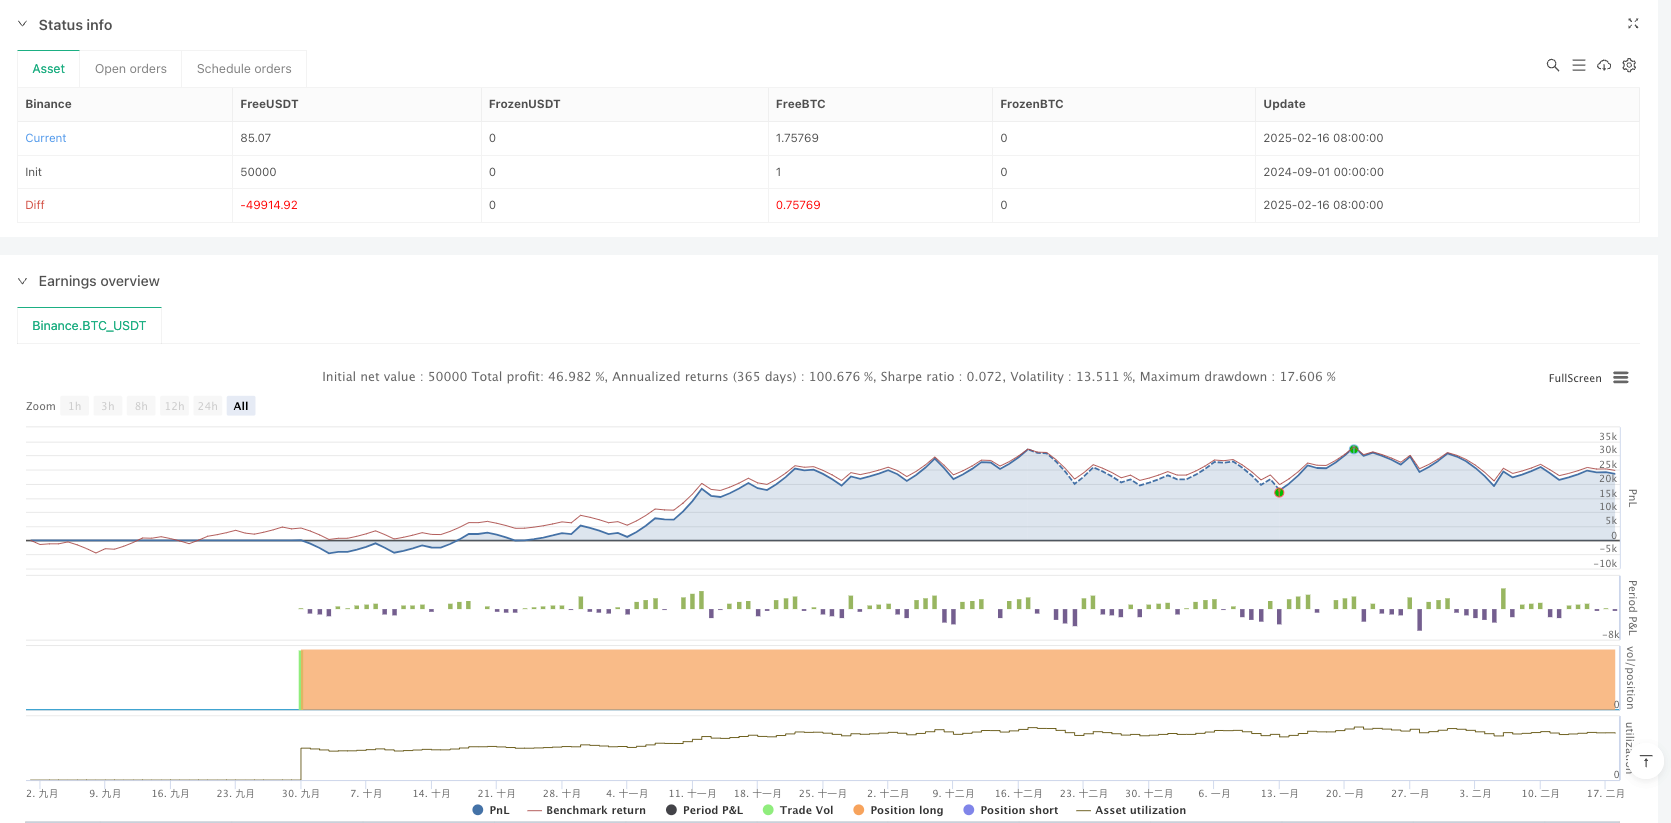
This is an efficient quantitative trading strategy based on price range and breakout. The strategy primarily identifies consolidation zones in the market and executes trades when prices break out of these zones. It uses the ZigZag indicator to identify key price points, combines highs and lows to define consolidation areas, and generates trading signals when prices break through these areas.
Strategy Principles
The core logic includes the following key steps: 1. Identify important turning points through highest and lowest prices within the Loopback Period 2. Use ZigZag algorithm to track price movements and determine key support and resistance levels 3. Confirm valid consolidation zones by setting minimum consolidation length 4. Dynamically update upper and lower boundaries to track changes in consolidation areas 5. Trigger trading signals when price breaks out of consolidation zones
Strategy Advantages
- High Adaptability - Strategy can dynamically identify and update consolidation zones, adapting to different market environments
- Controlled Risk - Provides clear stop-loss positions through well-defined consolidation zones
- Visual Support - Offers visualization of consolidation areas, helping traders understand market conditions
- Bi-directional Trading - Supports both upward and downward breakout opportunities, maximizing market opportunities
- Adjustable Parameters - Provides multiple adjustable parameters for optimization based on different market characteristics
Strategy Risks
- False Breakout Risk - Market may exhibit false breakouts leading to failed trades
- Slippage Risk - May face significant slippage in fast-moving markets
- Market Environment Dependency - Strategy performs well in ranging markets but may underperform in trending markets
- Parameter Sensitivity - Improper parameter settings may affect strategy performance
- Money Management Risk - Requires proper control of position sizing for each trade
Strategy Optimization Directions
- Incorporate Volume Indicators - Confirm breakout validity through volume analysis
- Optimize Entry Timing - Add pullback confirmation mechanism to improve entry quality
- Enhance Stop-Loss Mechanism - Design more flexible stop-loss strategies
- Add Market Environment Filters - Include trend assessment to operate in suitable market conditions
- Optimize Parameter Adaptation - Automatically adjust parameters based on market volatility
Summary
This is a well-designed quantitative trading strategy with clear logic. Through the identification of consolidation zones and capture of breakout signals, it provides traders with a reliable trading system. The strategy’s visualization capabilities and parameter flexibility make it highly practical. Through continuous optimization and risk control, this strategy has the potential to achieve stable returns in actual trading.
/*backtest
start: 2024-09-01 00:00:00
end: 2025-02-18 08:00:00
period: 5d
basePeriod: 5d
exchanges: [{"eid":"Binance","currency":"BTC_USDT"}]
*/

// This code is released under the Mozilla Public License 2.0
// More details at: https://mozilla.org/MPL/2.0/
// © LonesomeTheBlue

//@version=5
strategy("Consolidation Zones - Live [Strategy]", overlay=true, max_bars_back=1100)

//-----------------------------------------------------------------------//
//                        Input Variables
//-----------------------------------------------------------------------//
prd       = input.int(defval=10, title="Loopback Period", minval=2, maxval=50)
conslen   = input.int(defval=5,  title="Min. Consolidation Length", minval=2, maxval=20)
paintcons = input.bool(defval=true, title="Color Consolidation Zone?")
zonecol   = input.color(defval=color.new(color.blue, 70), title="Zone Color")

//-----------------------------------------------------------------------//
//                  Variables and Calculations for ZZ (ZigZag) Detection
//-----------------------------------------------------------------------//

// Check if the bar has the highest High or lowest Low in the last prd bars
float hb_ = ta.highestbars(prd) == 0 ? high : na
float lb_ = ta.lowestbars(prd)  == 0 ? low  : na

// Convert to bool to check if hb_ and lb_ are valid (not na)
bool hasHb = not na(hb_)
bool hasLb = not na(lb_)

// Direction variable to determine the trend, based on the last high or low pivot
var int dir = 0

// ZigZag value and last pivot
float zz = na
float pp = na

// 1) Determine direction based on whether a high or low pivot occurred
dir := if hasHb and not hasLb
    1
else if hasLb and not hasHb
    -1
else
    dir  // unchanged direction

// 2) If both a high and low pivot occurred in the same bar
bool sameBar = hasHb and hasLb
if sameBar
    if dir == 1
        zz := hb_
    else
        zz := lb_
else
    zz := hasHb ? hb_ : (hasLb ? lb_ : na)

// 3) Storing last pivots (pp) - iterate over older bars
for x = 0 to 1000
    if na(close) or dir != dir[x]
        break
    if not na(zz[x])  // if zz[x] is a valid value
        if na(pp)
            pp := zz[x]
        else
            if dir[x] == 1 and zz[x] > pp
                pp := zz[x]
            if dir[x] == -1 and zz[x] < pp
                pp := zz[x]

//-----------------------------------------------------------------------//
//                Logic for Consolidation Zone Detection
//-----------------------------------------------------------------------//
var int   conscnt    = 0
var float condhigh   = na
var float condlow    = na

float H_ = ta.highest(conslen)
float L_ = ta.lowest(conslen)

var line upline      = na
var line dnline      = na

bool breakoutup    = false
bool breakoutdown  = false

// Check if pp has changed
bool changedPP = ta.change(pp) != 0

if changedPP
    // If enough candles are in consolidation, check for breakout
    if conscnt > conslen and not na(condhigh) and not na(condlow) and not na(pp)
        if pp > condhigh
            breakoutup := true
        if pp < condlow
            breakoutdown := true

    // Check if we are still "in the zone"
    bool inZone = conscnt > 0 and not na(pp) and not na(condhigh) and not na(condlow) and (pp <= condhigh) and (pp >= condlow)
    if inZone
        conscnt += 1
    else
        conscnt := 0
else
    // No change in pivot -> continue consolidation
    conscnt += 1

if conscnt >= conslen
    // At the first "touch" of the required number of candles
    if conscnt == conslen
        condhigh := H_
        condlow  := L_
    else
        condhigh := math.max(condhigh, high)
        condlow  := math.min(condlow, low)


//-----------------------------------------------------------------------//
//                          Drawing Fill
//-----------------------------------------------------------------------//
// Declare two plot variables (just ordinary assignment)
condHighPlot = plot(condhigh, color=na, style=plot.style_stepline)
condLowPlot  = plot(condlow,  color=na, style=plot.style_stepline)

// bool to check if we want to color the zone
bool doFill = paintcons and (conscnt > conslen)

// Calling fill
fill(condHighPlot, condLowPlot, color= doFill ? zonecol : color.new(color.white, 100))

//-----------------------------------------------------------------------//
//                          Alerts & STRATEGY
//-----------------------------------------------------------------------//
alertcondition(breakoutup,   title="Breakout Up",   message="Breakout Up")
alertcondition(breakoutdown, title="Breakout Down", message="Breakout Down")

if breakoutup
    // Close short first
    if strategy.position_size < 0
        strategy.close("Breakout Short")
    // Open LONG
    strategy.entry("Breakout Long", strategy.long)

if breakoutdown
    // Close long first
    if strategy.position_size > 0
        strategy.close("Breakout Long")
    // Open SHORT
    strategy.entry("Breakout Short", strategy.short)