Momentum Trend-Following SuperTrend and Stochastic Crossover Strategy

Overview
This strategy is a trend-following trading system that combines the SuperTrend indicator with the Stochastic Oscillator. It identifies market trend direction using the SuperTrend indicator while utilizing the Stochastic Oscillator's overbought and oversold signals as confirmation. The strategy employs momentum crossover methods to find optimal entry and exit points in the trend direction, achieving a perfect blend of trend following and momentum analysis.
Strategy Principles
The core logic is based on the coordination of two main indicators:
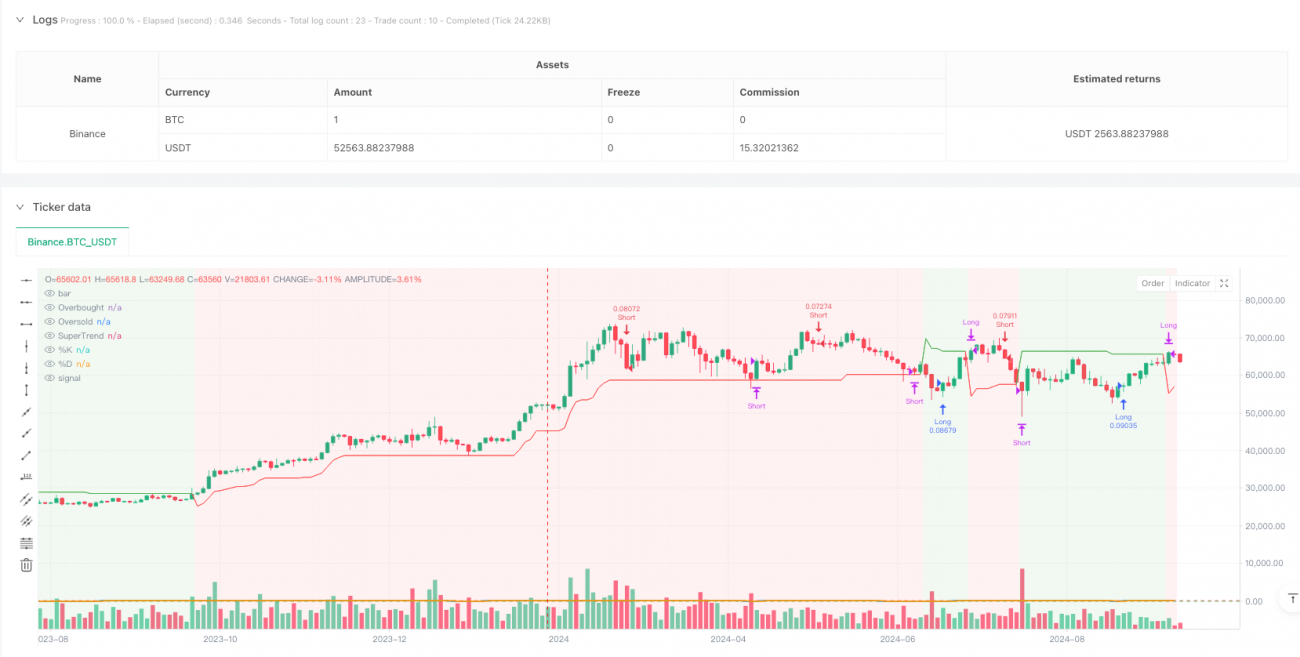
- SuperTrend Indicator: Calculated based on ATR (Average True Range), used to determine market trends. A change from red to green indicates an uptrend, while green to red indicates a downtrend. The indicator parameters use an ATR period of 10 and a multiplier factor of 3.0.
- Stochastic Oscillator: Used to identify market overbought and oversold conditions. Uses %K period of 14, %D period of 3, with overbought level at 80 and oversold level at 20.
Trading rules are as follows:
- Long Entry: SuperTrend shows uptrend (green), and Stochastic %K line crosses above the oversold level (20)
- Short Entry: SuperTrend shows downtrend (red), and Stochastic %K line crosses below the overbought level (80)
- Long Exit: SuperTrend turns to downtrend, or Stochastic %K line crosses below overbought level
- Short Exit: SuperTrend turns to uptrend, or Stochastic %K line crosses above oversold level
Strategy Advantages
- Trend Confirmation: Effectively identifies market main trends through SuperTrend indicator, reducing false breakout risks
- Momentum Verification: Combines momentum signals from Stochastic indicator, improving trade accuracy and timeliness
- Risk Control: Uses overbought and oversold levels as reference for stop-loss and take-profit, providing a clear risk management framework
- Visualization: Strategy provides intuitive graphical interface, including trend background colors and indicator line changes, facilitating market state understanding
- Parameter Flexibility: All key parameters can be optimized and adjusted according to different market characteristics
Strategy Risks
- Consolidation Market Risk: May generate frequent false signals during sideways consolidation, leading to overtrading
- Lag Risk: Both SuperTrend and Stochastic indicators have inherent lag, potentially missing optimal entry points
- Parameter Sensitivity: Different parameter settings may lead to significantly different trading results, requiring thorough testing
- Market Environment Dependency: Strategy performs well in strong trend markets but may underperform in highly volatile markets
- Signal Conflict: The two indicators may produce contradictory signals, requiring clear priority rules
Strategy Optimization Directions
- Introduce Volatility Filter: Can add ATR threshold judgment to pause trading during high volatility
- Optimize Signal Confirmation: Consider adding moving averages or other auxiliary indicators to improve signal reliability
- Improve Stop-Loss Mechanism: Recommend adding trailing stop-loss functionality to better protect profits
- Add Time Filtering: Adjust strategy parameters or pause trading based on different time period market characteristics
- Develop Adaptive Parameters: Design adaptive parameter mechanisms to dynamically adjust strategy parameters based on market conditions
Summary
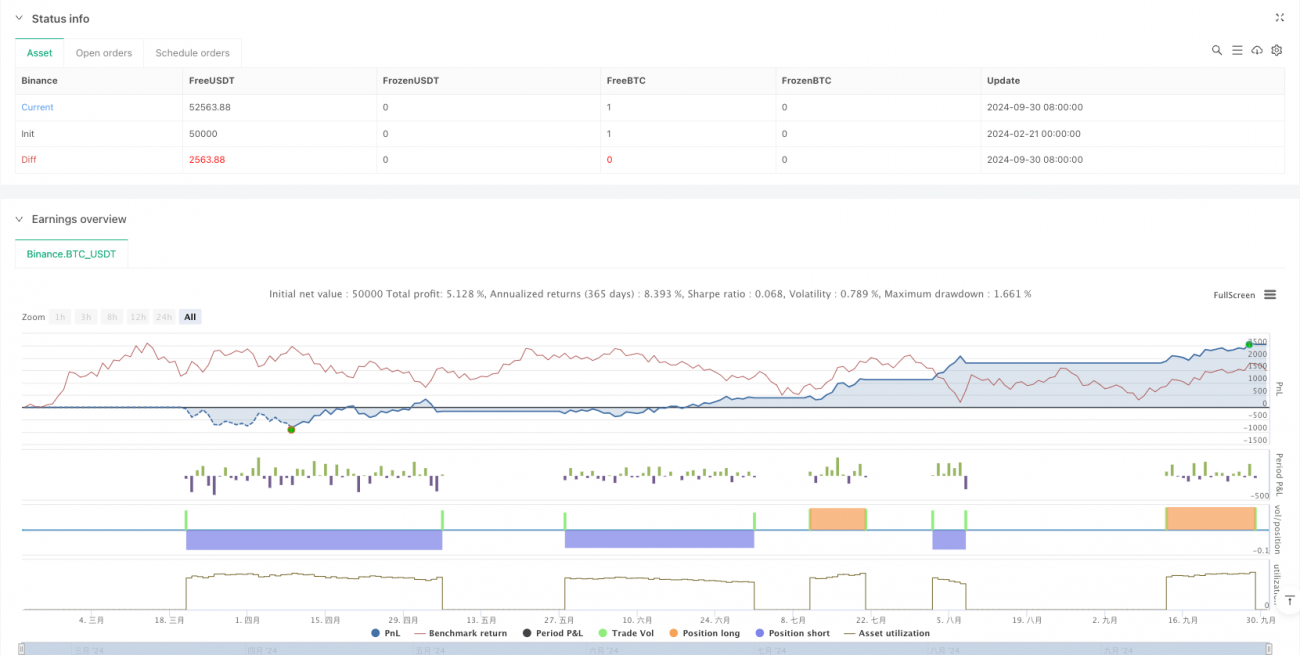
This strategy builds a relatively complete trading system by combining trend following and momentum analysis. It not only provides clear entry and exit signals but also includes frameworks for risk management and parameter optimization. While there are some inherent risks, the stability and adaptability of the strategy can be further enhanced through the provided optimization suggestions. It is suitable for traders who wish to capture opportunities in trending markets.
/*backtest
start: 2024-02-21 00:00:00
end: 2024-10-01 00:00:00
period: 2d
basePeriod: 2d
exchanges: [{"eid":"Binance","currency":"BTC_USDT"}]
*/

//@version=5
strategy("SuperTrend + Stochastic Strategy", overlay=true, default_qty_type=strategy.percent_of_equity, default_qty_value=10)

// SuperTrend Settings- 1