
Overview
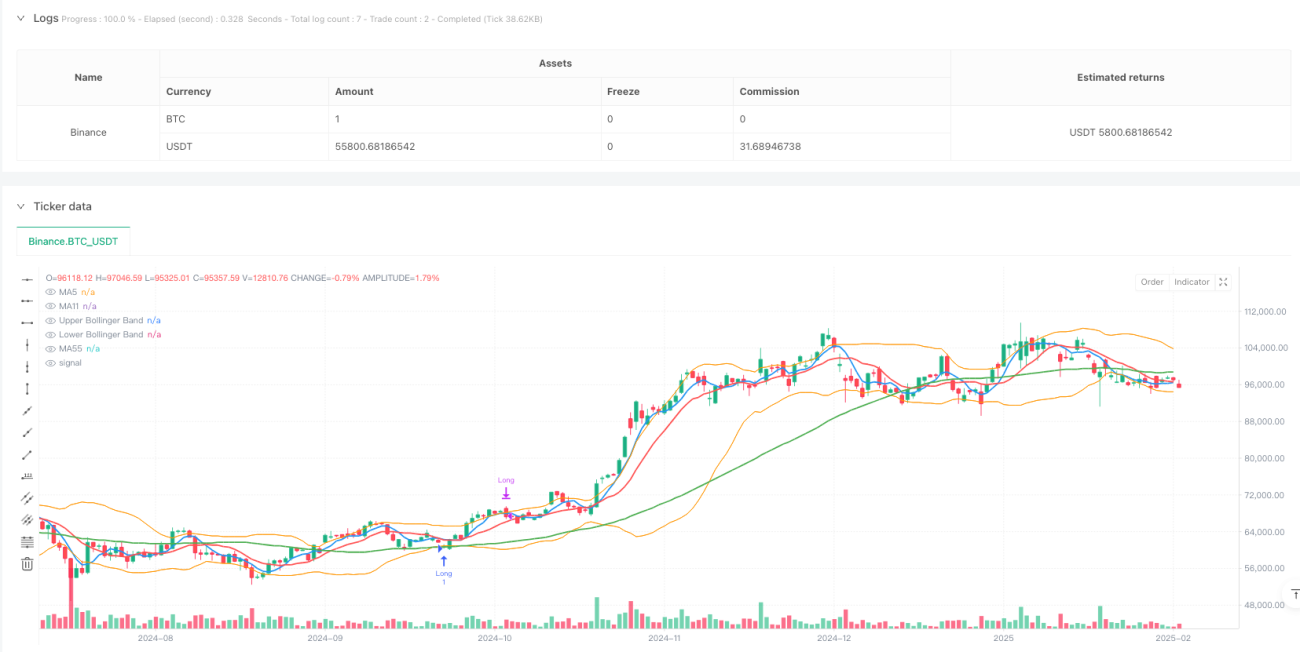
This strategy is an advanced quantitative trading system based on multiple moving averages and Bollinger Bands indicators. The core strategy uses the crossover signals of 5-period and 11-period moving averages as the primary entry criteria, combined with 55-period moving average and Bollinger Bands for signal filtering and risk control. This strategy is particularly suitable for options trading, especially for ATM options on 3-minute and 5-minute timeframes.
Strategy Principles
The core logic of the strategy includes the following key elements:
- Utilizing crossovers between 5-period and 11-period moving averages for initial trading signals
- Confirming overall trend direction with 55-period moving average
- Using Bollinger Bands (22-period) with 1.5 standard deviation for overbought/oversold conditions
- Implementing dynamic stop-loss and take-profit targets using 14-period ATR
Specifically, long signals are generated when price is below the lower band and the 5-period MA crosses above the 11-period MA, while price remains above the 55-period MA. Conversely, short signals occur when price is above the upper band and the 5-period MA crosses below the 11-period MA, while price is below the 55-period MA.
Strategy Advantages
- Multiple timeframe confirmation enhances trading success rate
- Adaptive volatility-based stop-loss effectively controls risk
- Integration with Bollinger Bands improves entry timing accuracy
- Clear trading rules, easy to implement and backtest
- Achieves minimum 1:2 reward-to-risk ratio
- Particularly suitable for options trading, especially ATM options buying strategies
Strategy Risks
- May generate frequent false breakout signals in ranging markets
- Moving average system has inherent lag
- Bollinger Bands parameters require optimization for different market conditions
- ATR-based stops may be too wide during high volatility periods
Mitigation measures:
- Add volume confirmation
- Recommend trading in clear trend environments
- Regular review and adjustment of Bollinger Bands parameters
- Consider implementing fixed stop-loss limits
Strategy Optimization Directions
- Introduce volume indicators for signal confirmation
- Develop adaptive Bollinger Bands parameter adjustment mechanism
- Add market environment identification module
- Optimize stop-loss strategy, consider implementing trailing stops
- Include time filters to avoid trading during inactive periods
These optimizations will help improve strategy stability and profitability, particularly adaptability across different market conditions.
Summary
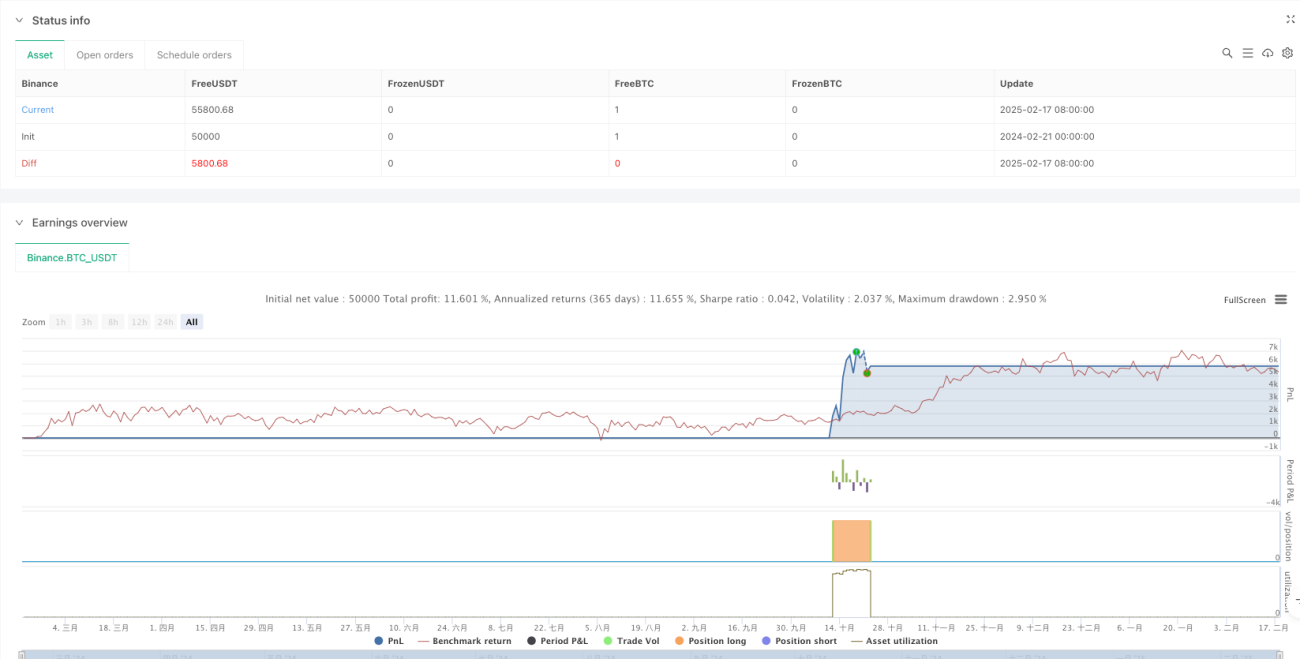
This strategy constructs a relatively complete trading system by combining multiple technical indicators. Its core strengths lie in the multi-layered signal confirmation mechanism and dynamic risk management approach. While there is room for optimization, the basic framework is robust and particularly suitable for options traders. Through continuous optimization and improvement, the strategy has the potential to achieve better performance in actual trading.
- 1