
Overview
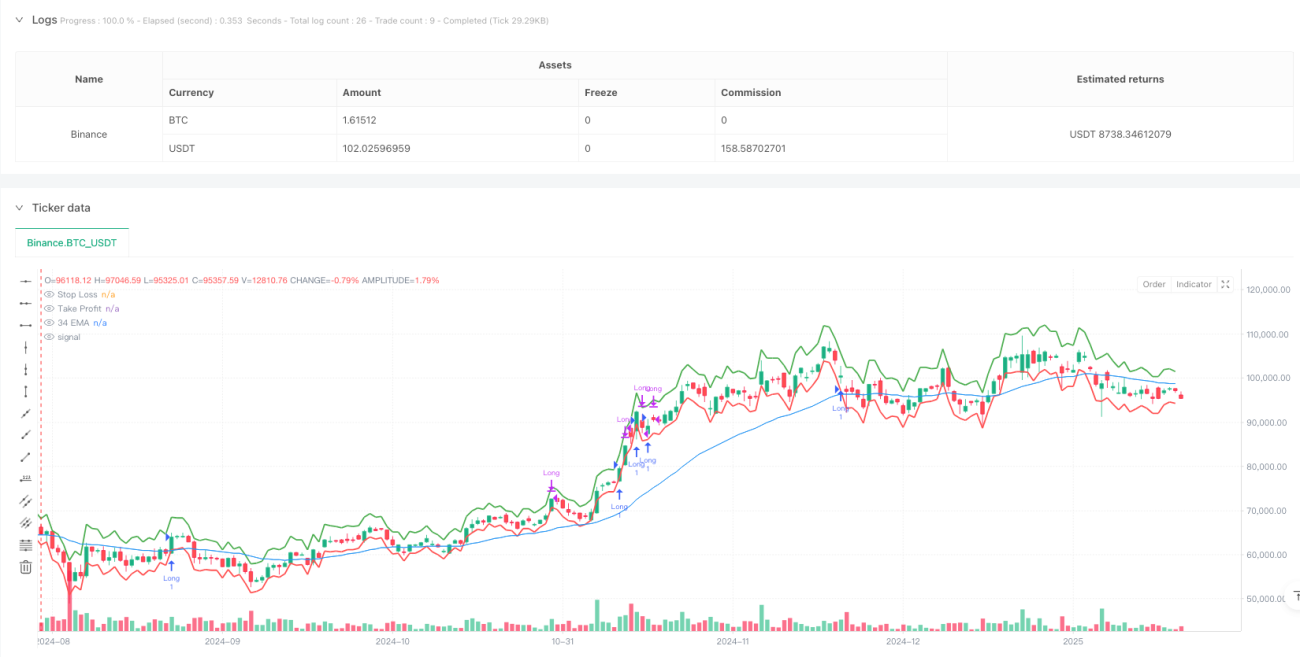
This strategy is a trading system that combines trend following and momentum reversal. It primarily uses a 34-period EMA to determine the overall trend, RSI indicator to identify overbought/oversold areas, while incorporating candlestick patterns and volume confirmation. The strategy employs ATR-based dynamic stop-loss and take-profit levels, allowing for adaptive parameter adjustment based on market volatility.
Strategy Principles
The core logic includes the following key elements:
- Trend Determination: Uses 34-period EMA as the main trend indicator, only seeking long opportunities when price is above EMA
- Entry Conditions: Requires a consecutive "bearish-bullish-bullish" candlestick pattern
- Momentum Confirmation: Uses RSI indicator for momentum confirmation, requiring RSI value above 50 to confirm upward momentum
- Volume Filter: Requires current volume to be above 20-period average volume, ensuring sufficient market participation
- Risk Management: Uses 1.5x ATR for profit target and 1x ATR for stop-loss placement
Strategy Advantages
- Multiple Signal Confirmation: Combines trend, pattern, momentum, and volume dimensions for trade confirmation, effectively reducing false signals
- Dynamic Risk Management: ATR-based stop-loss and profit targets automatically adjust to market volatility
- Trend Following Characteristics: Ensures trading in the direction of the main trend through EMA, improving win rate
- Flexible Parameter Settings: Key parameters such as EMA period, RSI thresholds, ATR multipliers can be adjusted to adapt to different market conditions
Strategy Risks
- Trend Reversal Risk: May experience consecutive losses at trend turning points
- False Breakout Risk: Candlestick patterns may produce false breakouts leading to incorrect signals
- Market Volatility Risk: During periods of intense volatility, ATR values may abnormally expand, affecting stop-loss placement
- Parameter Sensitivity: Optimal parameters may vary significantly across different market environments
Strategy Optimization Directions
- Add Trend Strength Filter: Can introduce ADX indicator to measure trend strength, trading only in strong trends
- Improve Exit Mechanism: Can add trailing stops to protect existing profits
- Optimize Volume Indicator: Consider using relative volume or volume breakout indicators
- Add Time Filters: Can incorporate trading time windows to avoid highly volatile periods
- Introduce Market Environment Classification: Dynamically adjust strategy parameters based on different market conditions
Summary
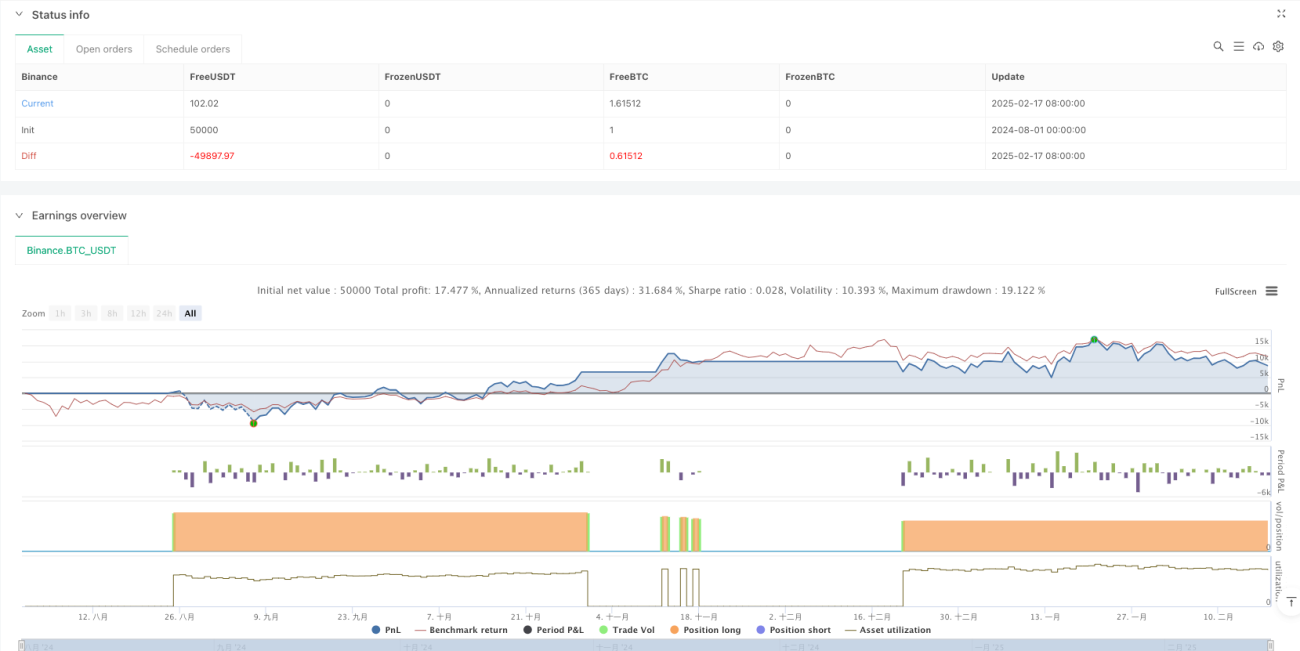
The strategy builds a complete trading system by combining multiple technical indicators, offering good adaptability and scalability. Its core advantages lie in multi-dimensional signal confirmation and dynamic risk management, while attention needs to be paid to parameter optimization and market environment adaptability. Through continuous optimization and improvement, the strategy has the potential to maintain stable performance across different market conditions.
- 1