Z-Score Momentum Trading System with ATR Stop-Loss and Risk-Reward Optimization

Overview
This strategy is a comprehensive trading system that combines multiple technical indicators, primarily based on Z-score to measure volume and candlestick body size anomalies, while using ATR (Average True Range) for dynamic stop-loss placement. The system also integrates Risk-Reward Ratio (RR) for profit target optimization and provides reliable trading signals through multi-dimensional technical analysis.
Strategy Principles
The core logic of the strategy is based on several key components:
- Z-score Analysis: Calculates standard deviations of trading volume and candlestick bodies to identify market activity anomalies
- Trend Confirmation: Analyzes adjacent candlestick highs/lows and closing prices to confirm trend direction
- ATR Stop-Loss: Uses dynamic ATR values for stop-loss placement, providing flexible risk control
- Risk-Reward Ratio: Automatically calculates profit targets based on the set RR ratio
- Visual Markers: Indicates trading signals and key price levels on the chart
Strategy Advantages
- Multi-dimensional Signal Confirmation: Combines volume, price momentum, and trend direction for improved signal reliability
- Dynamic Risk Management: Implements adaptive stop-loss through ATR, better accommodating market volatility
- Flexible Parameter Configuration: Allows adjustment of Z-score thresholds, ATR multiplier, and risk-reward ratio
- Precise Entry Timing: Uses Z-score anomalies to identify key trading opportunities
- Clear Visualization: Clearly marks entry points, stop-loss levels, and profit targets on the chart
Strategy Risks
- Parameter Sensitivity: Z-score thresholds and ATR multiplier settings directly affect trading frequency and risk control
- Market Environment Dependency: May generate fewer signals in low-volatility environments
- Computational Complexity: Multiple indicator calculations may lead to signal generation delays
- Slippage Risk: May face execution price discrepancies from signal prices in fast markets
- False Breakout Risk: Potential for triggering incorrect breakout signals in ranging markets
Strategy Optimization Directions
- Market Environment Filtering: Add volatility filters to dynamically adjust parameters in different market conditions
- Signal Confirmation Mechanism: Introduce additional technical indicators for cross-validation, such as RSI or MACD
- Position Management Optimization: Implement dynamic position sizing based on volatility and account risk
- Multiple Timeframe Analysis: Integrate higher timeframe trend confirmation to improve trade success rate
- Signal Filtering Enhancement: Add additional filtering conditions to reduce false signals
Summary
This strategy builds a complete trading system by combining Z-score analysis, ATR stop-loss, and risk-reward optimization. The system's strengths lie in its multi-dimensional signal confirmation and flexible risk management, while attention must be paid to parameter settings and market environment impacts. Through the suggested optimization directions, the strategy can further enhance its stability and adaptability.
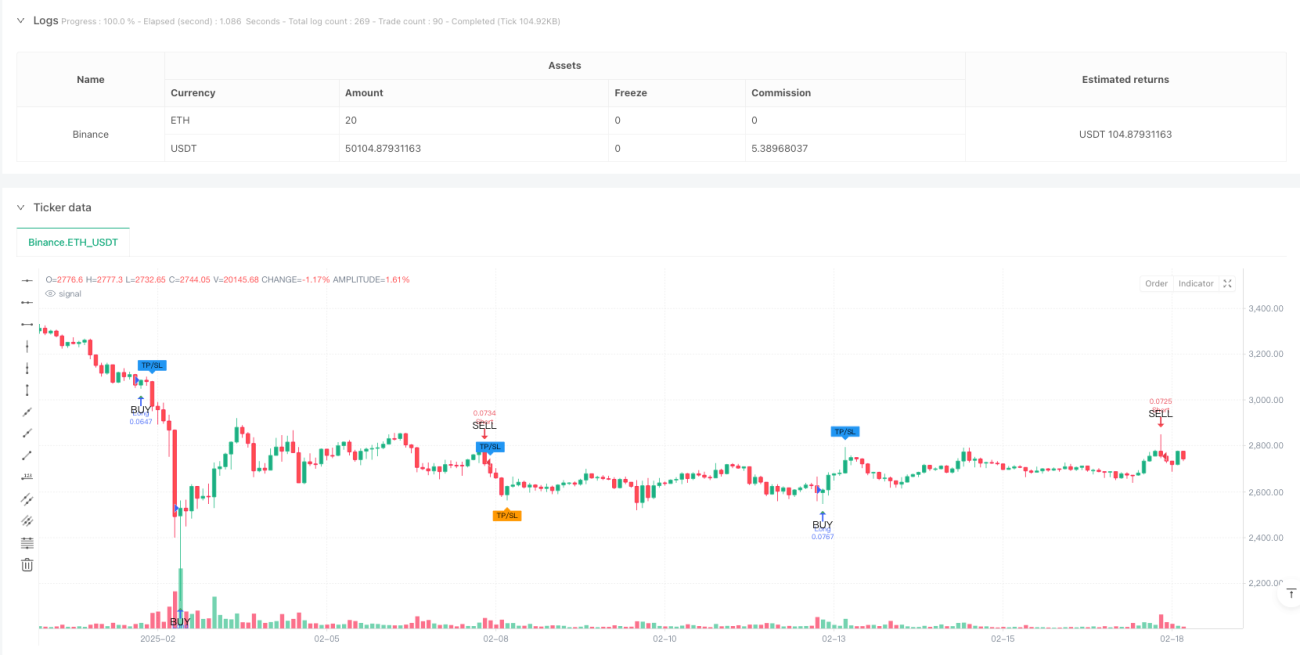
/*backtest
start: 2024-10-01 00:00:00
end: 2025-02-18 08:00:00
period: 2h
basePeriod: 2h
exchanges: [{"eid":"Binance","currency":"ETH_USDT"}]
*/

//@version=5
strategy("admbrk | Candle Color & Price Alarm with ATR Stop", overlay=true, initial_capital=50, default_qty_type=strategy.cash, default_qty_value=200, commission_type=strategy.commission.percent, commission_value=0.05, pyramiding=3)

// **Risk/Reward ratio (RR) as input**- 1