
Overview
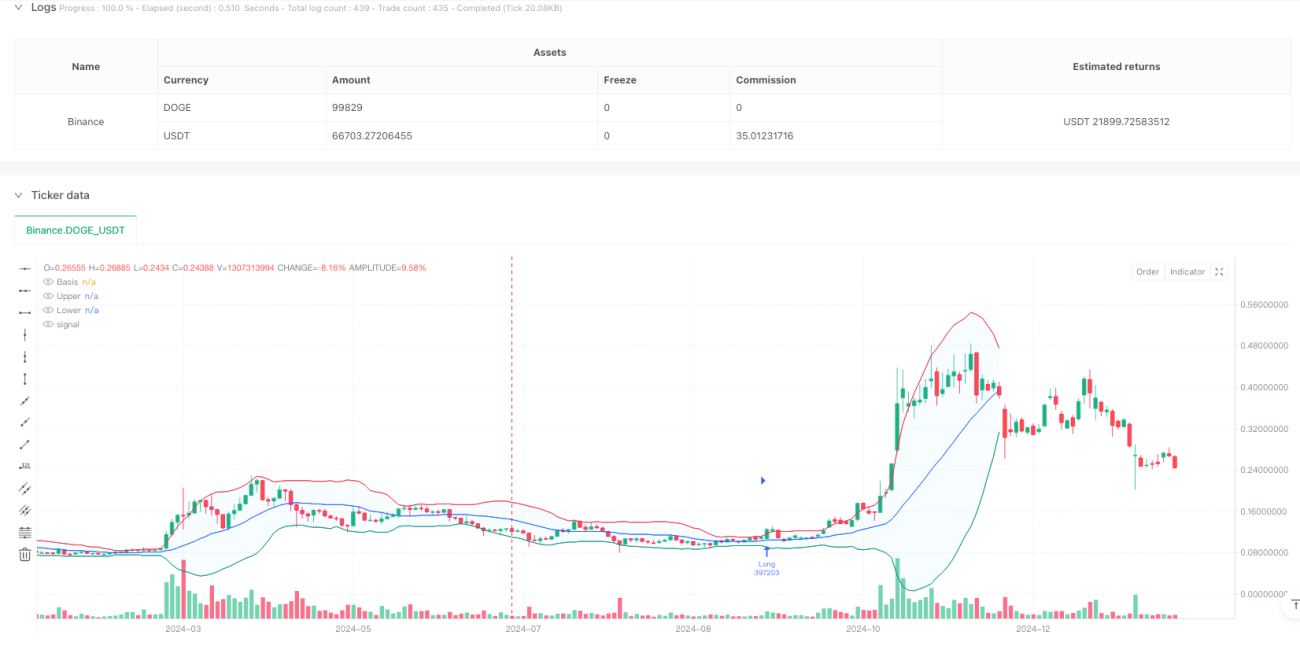
This strategy is a quantitative trading system based on Bollinger Bands dynamic breakout. It combines various types of moving averages (including SMA, EMA, SMMA, WMA, VWMA) to construct Bollinger Bands and makes trading decisions based on the relationship between price and the upper and lower bands. The core idea is to capture upward trends when price breaks above the upper band and exit when it falls below the lower band.
Strategy Principle
The strategy operates on several key elements:
- Calculates the middle band using selectable moving average types (SMA, EMA, etc.).
- Computes upper and lower bands using standard deviation multiplier (default 2.0).
- Opens long positions when closing price breaks above the upper band.
- Closes positions when closing price falls below the lower band.
The strategy includes date range filtering and slippage control mechanisms to enhance trading stability and reliability.
Strategy Advantages
- High Adaptability: Supports multiple moving average types, allowing optimal selection based on market characteristics.
- Comprehensive Risk Control: Adapts to market volatility changes through dynamic Bollinger Bands adjustment.
- Flexible Parameters: Allows adjustment of band length, standard deviation multiplier, etc., to suit different market conditions.
- Cost Consideration: Incorporates commission and slippage settings for realistic trading simulation.
- Rational Position Management: Uses account equity percentage for position control, effectively managing risk.
Strategy Risks
- False Breakout Risk: Frequent false signals may occur during market consolidation.
Solution: Add confirmatory indicators to validate breakouts. - Trend Reversal Risk: May lag during strong trend reversals.
Solution: Consider adding trend confirmation indicators. - Overtrading Risk: Frequent signals may lead to excessive trading costs.
Solution: Implement signal filtering mechanisms and holding time restrictions.
Strategy Optimization Directions
- Signal Confirmation Mechanism:
- Add volume confirmation indicators
- Implement trend direction filters
- Incorporate momentum indicators
- Risk Management Enhancement:
- Implement dynamic stop-loss mechanism
- Add maximum drawdown control
- Optimize position sizing algorithm
- Parameter Adaptation:
- Enable dynamic adjustment of Bollinger Bands parameters
- Adapt trading thresholds based on market volatility
Summary
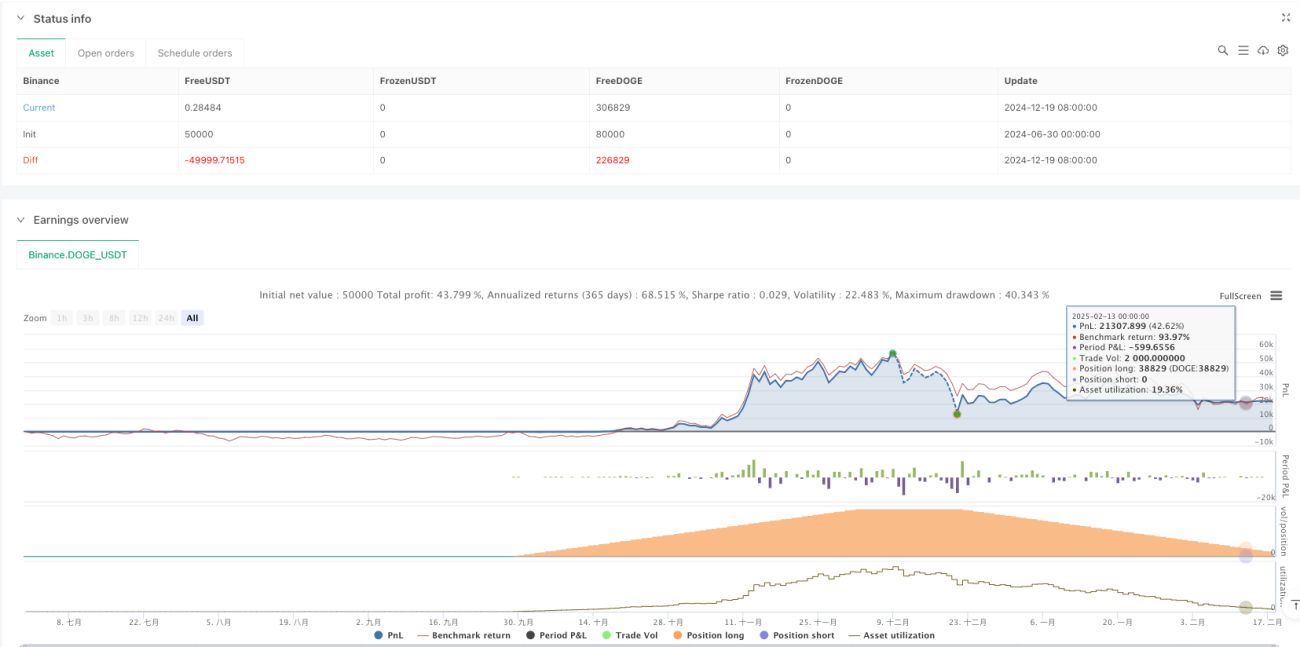
This is a complete trading system based on Bollinger Bands with good adaptability and scalability. Through the selection of various moving average types and flexible parameter settings, it can adapt to different market environments. While the strategy's risk management mechanisms are relatively comprehensive, there is still room for optimization. It is recommended to focus on enhancing signal confirmation mechanisms and optimizing risk management to improve strategy stability and profitability.
/*backtest
start: 2024-06-30 00:00:00
end: 2025-02-18 08:00:00
period: 2d
basePeriod: 2d
exchanges: [{"eid":"Binance","currency":"DOGE_USDT"}]
*/

//@version=6
strategy(shorttitle="BB Demo", title="Demo GPT - Bollinger Bands", overlay=true, commission_type=strategy.commission.percent, commission_value=0.1, slippage=0, default_qty_type=strategy.percent_of_equity, default_qty_value=100)

// Inputs- 1