Momentum-Enhanced SuperTrend-Stochastic Dual Indicator Trading Strategy

Overview
This is a composite trading strategy that combines the SuperTrend indicator with the Stochastic Oscillator. The strategy utilizes SuperTrend to identify market trend direction while using the Stochastic Oscillator to confirm price momentum, thereby generating more accurate trading signals. The strategy employs ATR (Average True Range) as volatility reference, tracking trends through dynamic support/resistance level adjustments.
Strategy Principles
The core logic is based on the following key components:
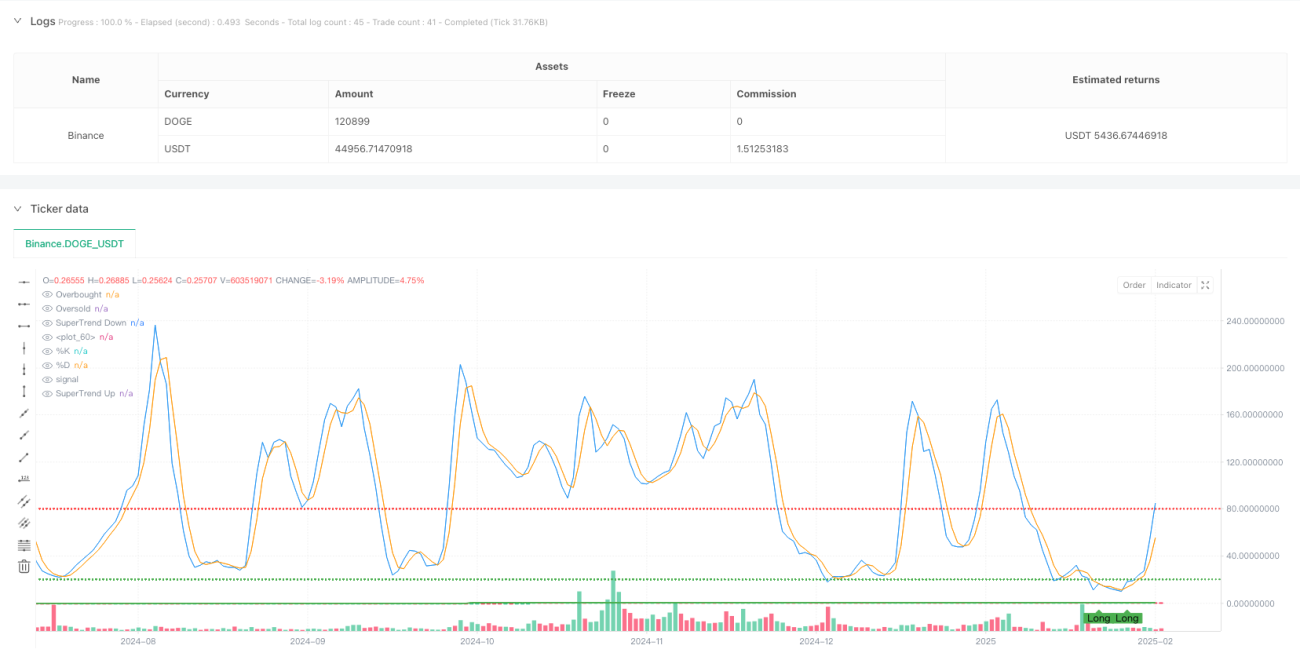
- SuperTrend indicator uses 10-period ATR and 3.0 multiplier to calculate dynamic support/resistance channels
- Stochastic Oscillator adopts classic parameters (14,3,3) to identify overbought/oversold areas
- Long conditions require:
- SuperTrend indicates bullish trend
- Stochastic %K line crosses above %D line
- %K value is in oversold area (below 20)
- Short conditions require:
- SuperTrend indicates bearish trend
- Stochastic %K line crosses below %D line
- %K value is in overbought area (above 80)
Strategy Advantages
- Combines trend following and momentum confirmation, significantly improving signal reliability
- Uses ATR to dynamically adjust SuperTrend channel width, better adapting to market volatility
- Filters extreme area counter-trend trades through Stochastic indicator's overbought/oversold levels
- Strict signal conditions effectively filter false breakouts, reducing fake signals
- Clear strategy logic with adjustable parameters, suitable for different market environments
Strategy Risks
- May generate excessive trading signals in ranging markets, increasing transaction costs
- Strict signal conditions might miss some potential trading opportunities
- SuperTrend indicator may lag during violent volatility
- Stochastic indicator might generate premature reversal signals in strong trend markets
Recommended risk control measures:
- Set reasonable stop-loss and take-profit levels
- Consider adding trend strength filter (like ADX)
- Dynamically adjust parameters based on market environment
Strategy Optimization Directions
- Introduce trend strength indicator (like ADX) to optimize trade filtering:
- Only enter positions during clear trends
- Can avoid frequent trading in ranging markets
- Optimize Stochastic indicator parameters:
- Consider using adaptive periods
- Dynamically adjust overbought/oversold thresholds based on volatility
- Improve money management system:
- Set dynamic stop-loss levels based on ATR
- Implement dynamic profit target adjustments
- Add time filtering functionality:
- Avoid low liquidity periods
- Pause trading before important data releases
Summary
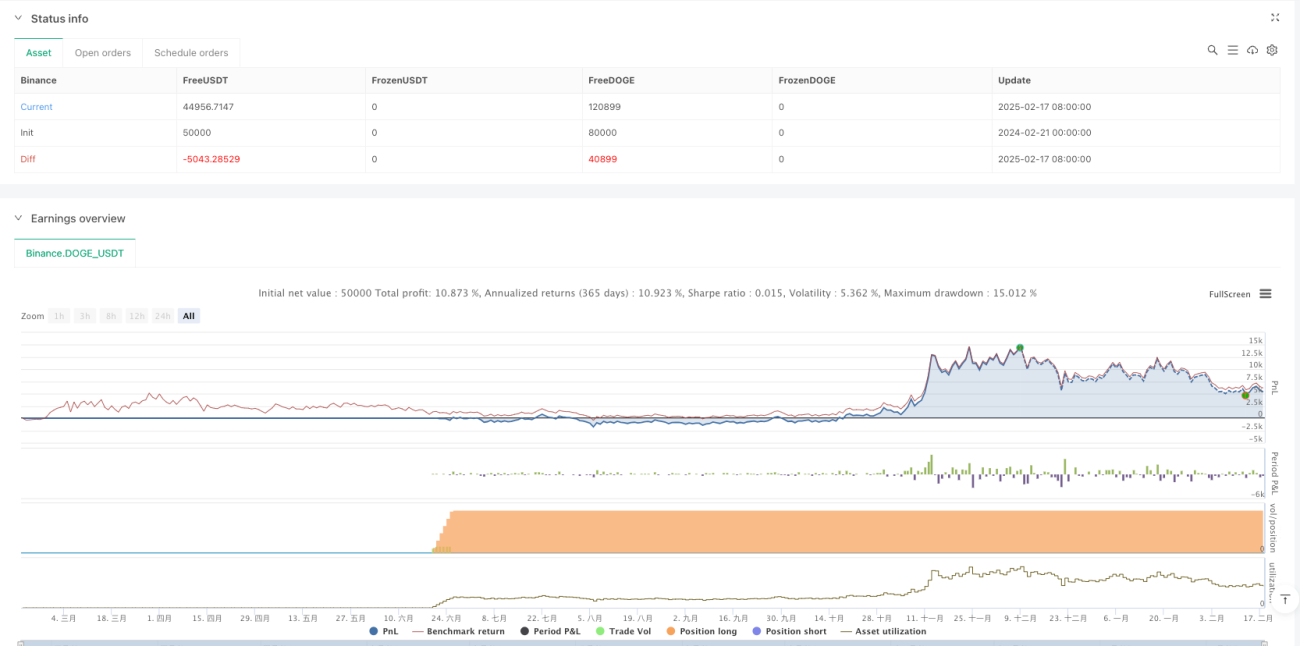
The strategy achieves an organic combination of trend following and momentum confirmation by combining SuperTrend and Stochastic Oscillator. The strategy design is reasonable with good adjustability and adaptability. Through the suggested optimization directions, the strategy's stability and profitability can be further improved. In live trading, it is recommended that traders make targeted parameter adjustments based on specific market characteristics and their own risk preferences.
/*backtest
start: 2024-02-21 00:00:00
end: 2025-02-18 08:00:00
period: 1d
basePeriod: 1d
exchanges: [{"eid":"Binance","currency":"DOGE_USDT"}]
*/

//@version=5
strategy("SuperTrend + Stochastic Strategy", overlay=true, default_qty_type=strategy.percent_of_equity, default_qty_value=10)

// === Vstupy ===- 1