Advanced Momentum Oscillator and Bollinger Bands Quantitative Strategy System

Overview
This strategy is an advanced quantitative trading system that combines the Chande Momentum Oscillator (CMO) and Bollinger Bands. It identifies overbought and oversold market conditions by analyzing price volatility and momentum indicators to generate precise trading signals. The strategy employs a dual-verification mechanism of momentum reversal and price channel breakout to effectively enhance trading reliability.
Strategy Principles
The core logic is based on the following key components:
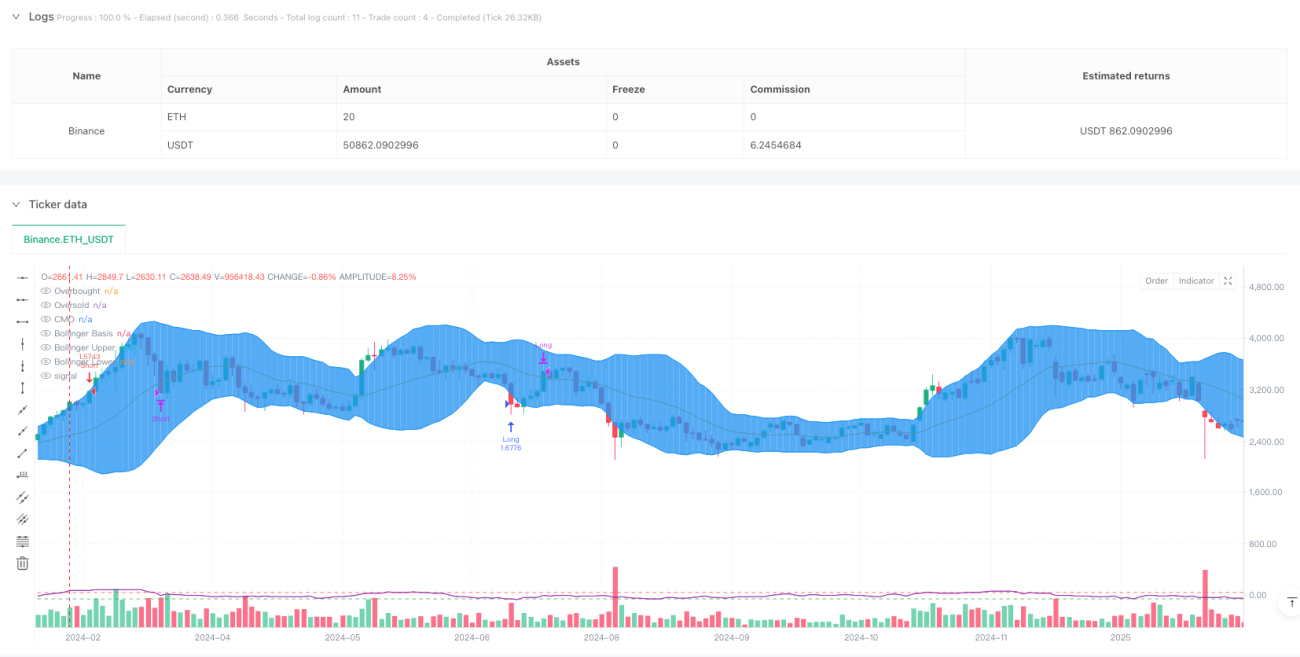
- Bollinger Bands System: Uses a 20-period moving average as the middle band, with a standard deviation multiplier of 2.0 to form the upper and lower bands. This setup effectively captures price volatility range and breakout direction.
- CMO Indicator System: Employs a 14-period setting with an overbought threshold of 50 and oversold threshold of -50. This indicator measures market force balance by calculating the difference between upward and downward momentum.
- Trading Signal Generation Mechanism:
- Long Entry: Price crosses below the lower Bollinger Band and CMO is below the oversold threshold
- Short Entry: Price crosses above the upper Bollinger Band and CMO is above the overbought threshold
- Exit Mechanism: Price crosses the Bollinger Band middle line or momentum indicator reaches the opposite extreme zone
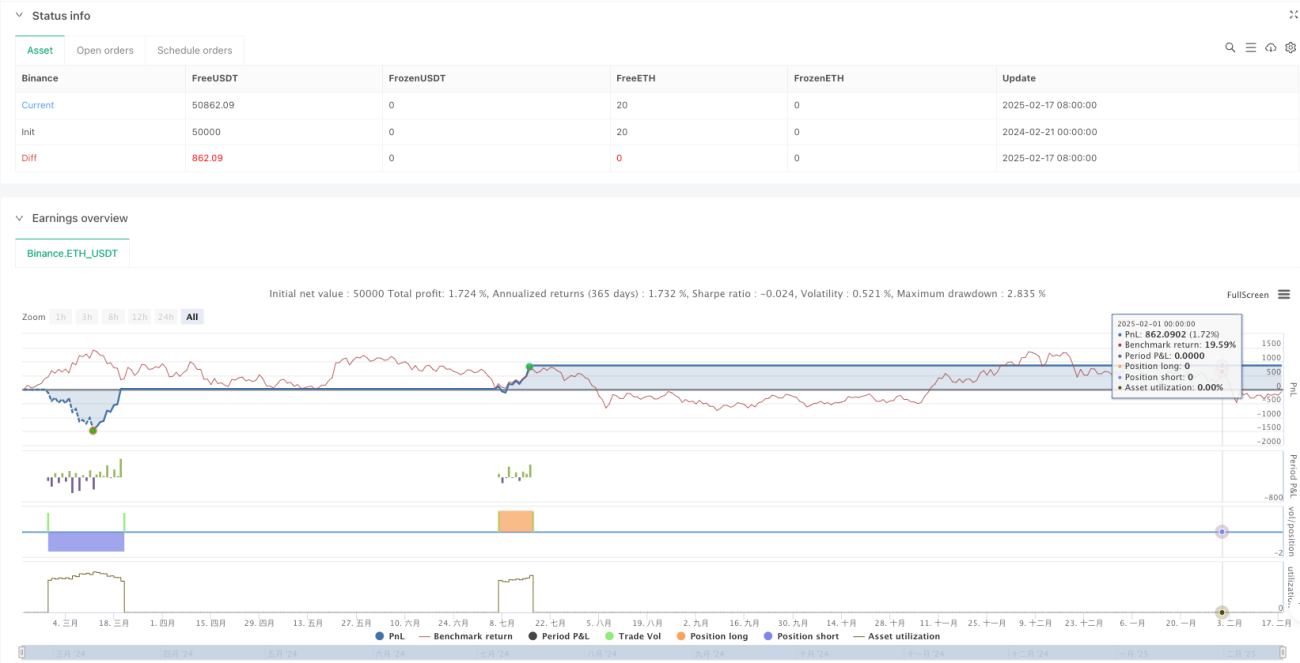
Strategy Advantages
- Multi-dimensional Confirmation: Significantly reduces false breakout risks through price and momentum dual verification.
- Strong Adaptability: Bollinger Bands automatically adjust trading ranges based on market volatility, adapting to different market environments.
- Comprehensive Risk Control: Uses Bollinger Band middle line as stop-loss reference, providing objective risk control standards.
- High Parameter Adjustability: Allows traders to optimize strategy performance by adjusting Bollinger Bands and CMO parameters for different market characteristics.
Strategy Risks
- Oscillation Market Risk: May generate frequent false signals in sideways markets.
Suggested Solution: Add filtering conditions, such as requiring price breakout to reach certain thresholds. - Trend Reversal Risk: Reversal signals in strong trends may lead to premature exits.
Suggested Solution: Incorporate trend indicators and trade only in the primary trend direction. - Parameter Sensitivity: Different parameter settings may cause significant variations in strategy performance.
Suggested Solution: Optimize parameter combinations through historical data backtesting.
Strategy Optimization Directions
- Dynamic Parameter Adjustment: Introduce adaptive mechanisms to dynamically adjust Bollinger Bands standard deviation multiplier based on market volatility.
- Signal Strength Classification: Establish a signal scoring system to adjust position sizes based on breakout strength and momentum levels.
- Market Environment Classification: Add market environment identification modules to use different parameter combinations in different market states.
- Profit-Taking Optimization: Develop volatility-based dynamic profit-taking mechanisms to improve strategy profitability.
Summary
This strategy constructs a complete trading system through the synergy of Bollinger Bands and CMO. While maintaining operational objectivity, the strategy enhances trading reliability through multiple confirmation mechanisms. Through reasonable parameter settings and risk control, the strategy demonstrates good practicality and scalability. Further optimization potential mainly focuses on dynamic adaptability and refined management.
/*backtest
start: 2024-02-21 00:00:00
end: 2025-02-18 08:00:00
period: 2d
basePeriod: 2d
exchanges: [{"eid":"Binance","currency":"ETH_USDT"}]
*/

//@version=5
strategy("Chande Momentum Oscillator + Bollinger Bands Strategy", overlay=true, default_qty_type=strategy.percent_of_equity, default_qty_value=10)

// Bollinger Bands Parameters- 1