Dynamic Adaptive Multi-Timeframe Trend Following and Range Reversal Hybrid Strategy

ICHIMOKU MACD RSI ATR STOCHASTIC RSI
Created on: 2025-02-20 14:25:14 Modified on: 2025-02-20 14:48:41
Copy: 0 Number of hits: 339
avatar of ianzeng123 ianzeng123
2
Follow
319
Followers

 Dynamic Adaptive Multi-Timeframe Trend Following and Range Reversal Hybrid Strategy  Dynamic Adaptive Multi-Timeframe Trend Following and Range Reversal Hybrid Strategy

Overview

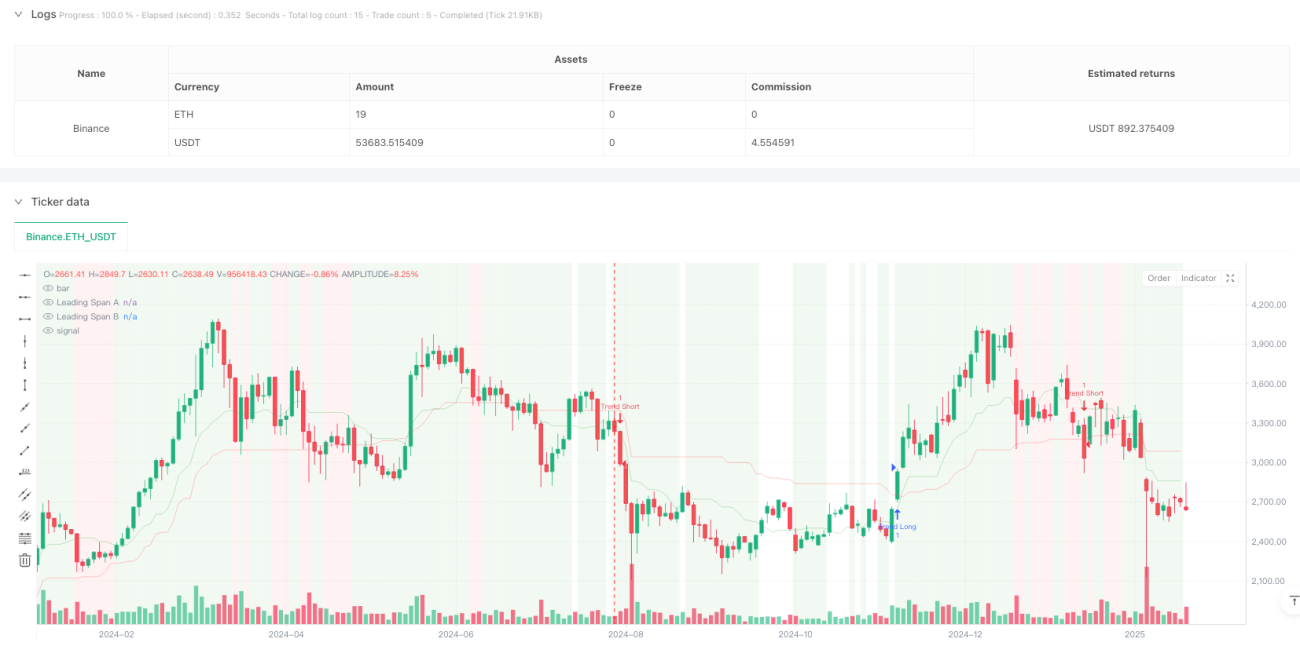
This strategy is a hybrid trading system that combines trend following and range trading, using the Ichimoku Cloud for market state identification, MACD for momentum confirmation, RSI for overbought/oversold conditions, and ATR for dynamic stop-loss management. The strategy can capture trending opportunities in trending markets and find reversal opportunities in ranging markets, showing strong adaptability and flexibility.

Strategy Principles

The strategy employs a multi-level signal confirmation mechanism: 1. Uses the Ichimoku Cloud as the primary indicator for market state determination, judging whether the market is trending or ranging based on price position relative to the cloud 2. In trending markets, enters long when price is above the cloud with RSI>55 and positive MACD histogram; enters short when price is below the cloud with RSI<45 and negative MACD histogram 3. In ranging markets, looks for long opportunities when RSI<30 and Stochastic RSI<20; looks for short opportunities when RSI>70 and Stochastic RSI>80 4. Uses ATR-based dynamic stop-loss for risk management, with stop-loss distance set at 2 times the ATR value

Strategy Advantages

  1. Strong market adaptability: Automatically adjusts trading strategy based on different market conditions, improving strategy stability
  2. High signal reliability: Uses multiple indicator verification mechanism to reduce false signals
  3. Comprehensive risk control: ATR dynamic stop-loss allows profits to develop while effectively controlling risk
  4. Good visualization: Market states are marked with background colors for intuitive understanding
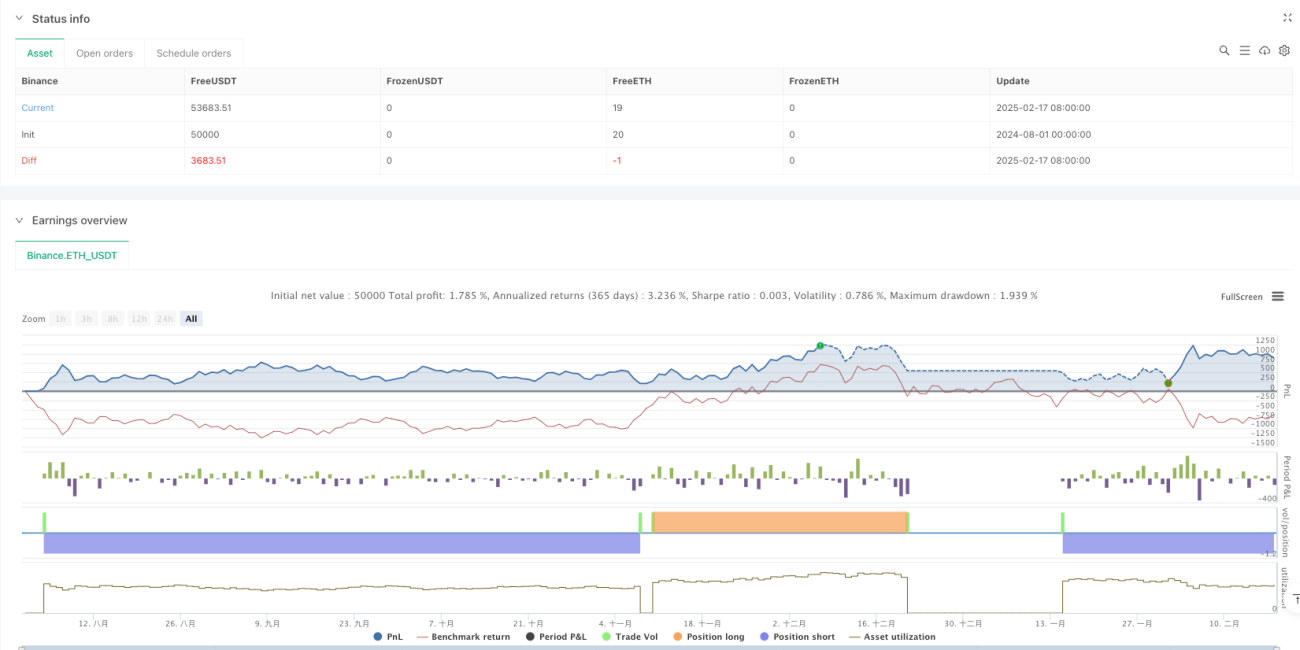
  5. Excellent performance on higher timeframes: Shows a profit factor of 2.159 with 10.71% net profit on daily timeframe

Strategy Risks

  1. Low win rate: Win rates below 40% across all timeframes, requiring strong psychological resilience
  2. Overtrading on lower timeframes: Executed 430 trades on 4-hour timeframe with lower efficiency
  3. Signal lag: Multiple indicator verification may cause missed market opportunities
  4. Complex parameter optimization: Multiple indicator combinations increase strategy optimization complexity

Strategy Optimization Directions

  1. Signal filtering optimization: Adjust indicator thresholds to improve win rate
  2. Timeframe adaptation: Recommended for daily and higher timeframes, with parameters adjustable to different market characteristics
  3. Stop-loss optimization: Consider dynamic adjustment of ATR multiplier based on market conditions
  4. Entry timing optimization: Add volume confirmation or price pattern confirmation to improve entry accuracy
  5. Position management optimization: Design dynamic position management system based on signal strength

Summary

This strategy is a well-designed, logically clear comprehensive trading system that achieves intelligent market state identification and precise capture of trading opportunities through multiple indicator coordination. While there are some issues on lower timeframes, it performs excellently on higher timeframes like daily. Traders are recommended to focus on daily timeframe signals when using it in live trading and adjust parameters according to their risk tolerance. Through continuous optimization and adjustment, this strategy has the potential to provide stable profit opportunities for traders.

Strategy source code
/*backtest
start: 2024-08-01 00:00:00
end: 2025-02-18 08:00:00
period: 2d
basePeriod: 2d
exchanges: [{"eid":"Binance","currency":"ETH_USDT"}]
*/

// This Pine Script™ code is subject to the terms of the Mozilla Public License 2.0 at https://mozilla.org/MPL/2.0/
// © FIWB

//@version=6
strategy("Refined Ichimoku with MACD and RSI Strategy", overlay=true)

// Inputs for Ichimoku Cloud
conversionLength = input.int(9, title="Conversion Line Length", group="Ichimoku Settings")
baseLength = input.int(26, title="Base Line Length", group="Ichimoku Settings")
laggingSpanLength = input.int(52, title="Lagging Span Length", group="Ichimoku Settings")
displacement = input.int(26, title="Displacement", group="Ichimoku Settings")

// Inputs for MACD
macdFastLength = input.int(12, title="MACD Fast Length", group="MACD Settings")
macdSlowLength = input.int(26, title="MACD Slow Length", group="MACD Settings")
macdSignalLength = input.int(9, title="MACD Signal Length", group="MACD Settings")

// Inputs for RSI/Stochastic RSI
rsiLength = input.int(14, title="RSI Length", group="Momentum Indicators")
stochRsiLength = input.int(14, title="Stochastic RSI Length", group="Momentum Indicators")
stochRsiK = input.int(3, title="%K Smoothing", group="Momentum Indicators")
stochRsiD = input.int(3, title="%D Smoothing", group="Momentum Indicators")

// Inputs for ATR
atrLength = input.int(14, title="ATR Length", group="Risk Management")
atrMultiplier = input.float(2.0, title="ATR Multiplier", group="Risk Management")

// Ichimoku Cloud Calculation
conversionLine = (ta.highest(high, conversionLength) + ta.lowest(low, conversionLength)) / 2
baseLine = (ta.highest(high, baseLength) + ta.lowest(low, baseLength)) / 2
leadingSpanA = (conversionLine + baseLine) / 2
leadingSpanB = (ta.highest(high, laggingSpanLength) + ta.lowest(low, laggingSpanLength)) / 2

// Market Regime Detection Using Ichimoku Cloud
priceAboveCloud = close >= leadingSpanA and close >= leadingSpanB
priceBelowCloud = close <= leadingSpanA and close <= leadingSpanB
priceNearCloud = close > leadingSpanB and close < leadingSpanA

trendingMarket = priceAboveCloud or priceBelowCloud
rangeBoundMarket = priceNearCloud

// MACD Calculation
macdLine = ta.ema(close, macdFastLength) - ta.ema(close, macdSlowLength)
macdSignalLine = ta.sma(macdLine, macdSignalLength)
macdHistogram = macdLine - macdSignalLine

// RSI Calculation
rsiValue = ta.rsi(close, rsiLength)

// Stochastic RSI Calculation
stochRsiKValue = ta.sma(ta.stoch(close, high, low, stochRsiLength), stochRsiK)
stochRsiDValue = ta.sma(stochRsiKValue, stochRsiD)

// Entry Conditions with Tightened Filters
trendLongCondition = trendingMarket and priceAboveCloud and rsiValue > 55 and macdHistogram > 0 and stochRsiKValue > stochRsiDValue
trendShortCondition = trendingMarket and priceBelowCloud and rsiValue < 45 and macdHistogram < 0 and stochRsiKValue < stochRsiDValue

rangeLongCondition = rangeBoundMarket and rsiValue < 30 and stochRsiKValue < 20
rangeShortCondition = rangeBoundMarket and rsiValue > 70 and stochRsiKValue > 80

// Risk Management: Stop-Loss Based on ATR
atrValue = ta.atr(atrLength)
longStopLoss = low - atrMultiplier * atrValue
shortStopLoss = high + atrMultiplier * atrValue

// Strategy Execution: Entries and Exits
if trendLongCondition
    strategy.entry("Trend Long", strategy.long)
    strategy.exit("Exit Trend Long", from_entry="Trend Long", stop=longStopLoss)

if trendShortCondition
    strategy.entry("Trend Short", strategy.short)
    strategy.exit("Exit Trend Short", from_entry="Trend Short", stop=shortStopLoss)

if rangeLongCondition
    strategy.entry("Range Long", strategy.long)
    strategy.exit("Exit Range Long", from_entry="Range Long", stop=longStopLoss)

if rangeShortCondition
    strategy.entry("Range Short", strategy.short)
    strategy.exit("Exit Range Short", from_entry="Range Short", stop=shortStopLoss)

// Visualization: Highlight Market Regimes on Chart Background
bgcolor(trendingMarket ? color.new(color.green, 90) : na)
bgcolor(rangeBoundMarket ? color.new(color.red, 90) : na)

// Plot Ichimoku Cloud for Visualization
plot(leadingSpanA, color=color.new(color.green, 80), title="Leading Span A")
plot(leadingSpanB, color=color.new(color.red, 80), title="Leading Span B")