
Overview
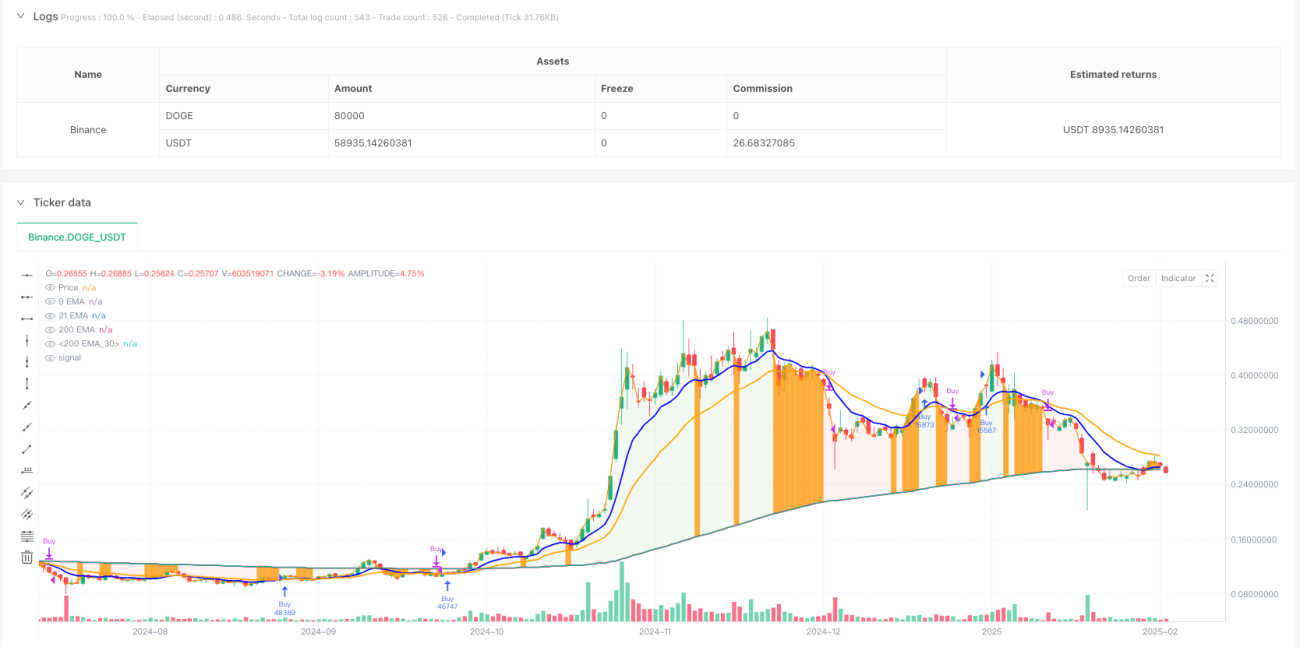
This strategy is a trend-following trading system based on multiple Exponential Moving Averages (EMAs) and cloud visualization. It utilizes 9-period, 21-period, and 200-period EMAs to determine market trends through price-EMA relationships and crossovers, generating trading signals upon trend confirmation. The system visually represents market trends through cloud color changes.
Strategy Principles
The core logic is based on the following key elements:
- Uses triple EMAs (9/21/200) to build a trend framework
- Determines short-term trends through price relation to 9 EMA and 9 EMA relation to 21 EMA
- Uses 200 EMA as a long-term trend reference
- Forms green cloud when price crosses above 9 EMA and 9 EMA crosses above 21 EMA, indicating bullish signal
- Forms red cloud when price crosses below 9 EMA and 9 EMA crosses below 21 EMA, indicating bearish signal
- Generates trading signals based on cloud color changes, entering long positions with green cloud and exiting with red cloud
Strategy Advantages
- Multiple timeframe analysis: Comprehensive trend capture through EMA combinations
- Visual clarity: Clear market state representation through cloud color changes
- Trend confirmation: Multiple confirmation mechanisms reduce false breakout risks
- Adaptability: EMAs give higher weight to recent prices for quick market adaptation
- Risk control: Built-in trend reversal exit mechanism effectively controls losses
Strategy Risks
- Choppy market risk: Frequent false signals during consolidation phases
- Lag risk: Moving average systems have inherent lag, may miss optimal entry points
- Trend reversal risk: Significant drawdowns possible during sudden trend reversals
- Parameter sensitivity: Optimal parameters may vary across market conditions
- Cloud judgment risk: Relying solely on cloud color may overlook other important market signals
Strategy Optimization Directions
- Add volume confirmation: Incorporate volume indicators to improve trend identification accuracy
- Optimize parameter adaptation: Dynamically adjust EMA parameters based on market volatility
- Implement stop-loss mechanisms: Set trailing or fixed stops for better risk control
- Add filters: Include ATR or RSI indicators to filter false signals
- Enhance exit mechanisms: Design more flexible profit-taking strategies
- Optimize position management: Dynamically adjust position sizes based on trend strength
Summary
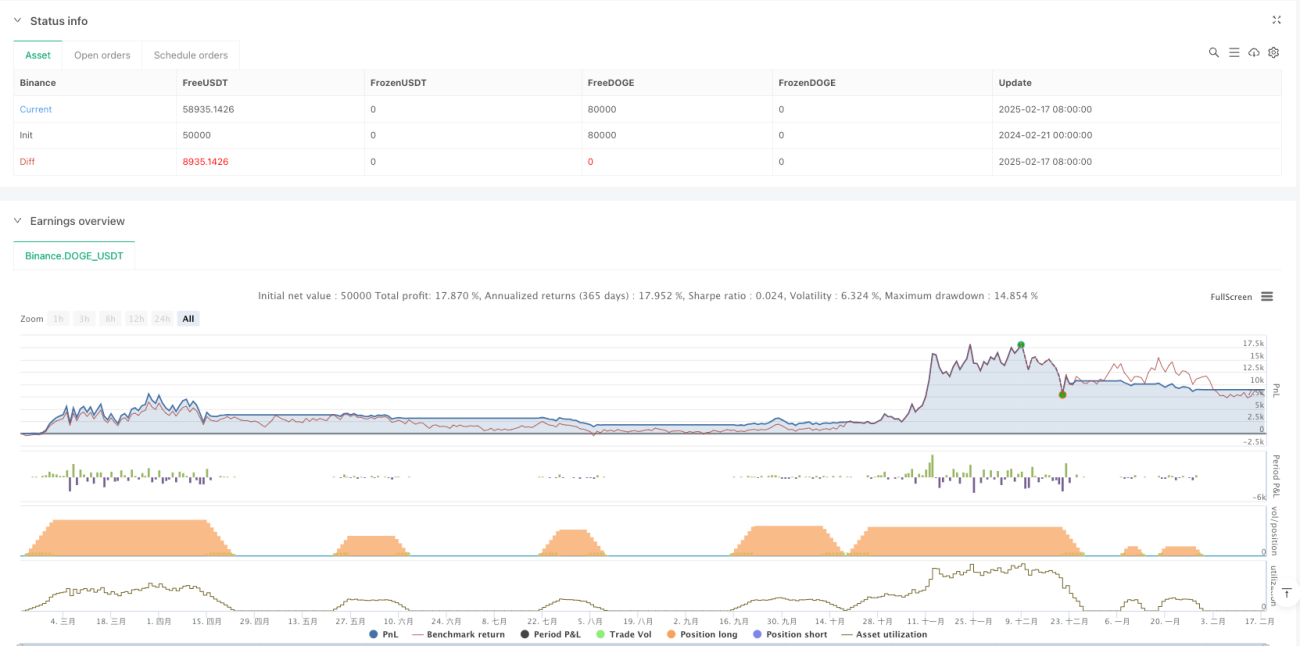
The Multi-EMA Cloud Trend Trading Strategy is a comprehensive trading system combining technical analysis and visual feedback. Through the coordinated use of multiple EMAs, it effectively captures market trends while visually displaying market conditions through cloud formation. While it has inherent lag and false signal risks, appropriate optimization and risk control measures can help achieve stable returns in trending markets. Traders are advised to thoroughly test parameter combinations and optimize according to specific market characteristics before live implementation.
- 1