
Overview
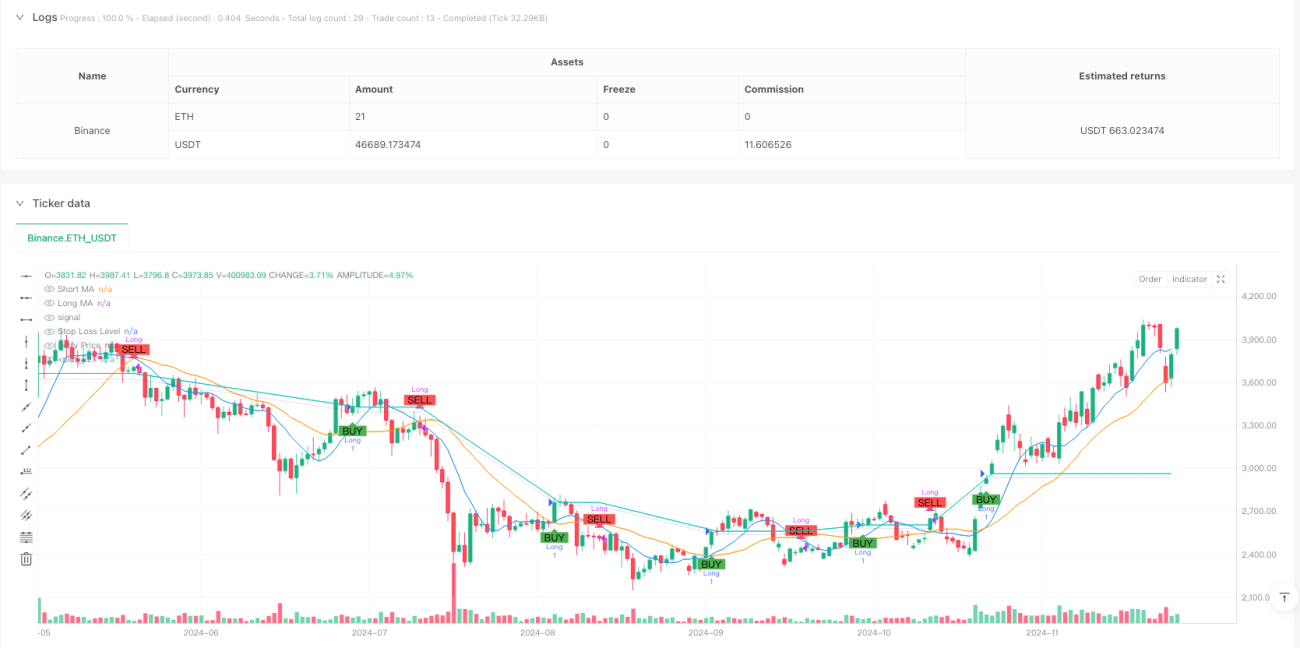
This strategy is a trend-following trading system based on dual moving average crossovers combined with risk management mechanisms. The strategy uses 9-period and 21-period Simple Moving Averages (SMA) to capture market trends, with 1% stop-loss and take-profit levels for risk control. The system enters long positions when the short-term MA crosses above the long-term MA and exits when the short-term MA crosses below the long-term MA.
Strategy Principles
The core logic is based on market trend continuity characteristics. By observing crossovers between short-term (9-period) and long-term (21-period) moving averages, the strategy identifies trend reversal points. A "Golden Cross" occurs when the short-term MA crosses above the long-term MA, signaling an uptrend and generating a long entry signal. A "Death Cross" occurs when the short-term MA crosses below the long-term MA, indicating potential trend reversal and triggering position closure. The strategy incorporates 1% stop-loss and take-profit mechanisms to limit losses during adverse market movements and secure profits at target levels.
Strategy Advantages
- Strong trend capture capability: Effectively identifies trend reversal points through dual MA crossovers.
- Comprehensive risk control: Fixed percentage stop-loss and take-profit levels effectively control per-trade risk.
- High automation level: System runs fully automatically without manual intervention.
- Good visualization: Clear graphical interface displaying trade signals and risk control zones.
- Flexible parameter optimization: MA periods and risk management levels can be adjusted for different market characteristics.
Strategy Risks
- Sideways market risk: Frequent MA crossovers in ranging markets may generate false signals.
- Slippage risk: Actual execution prices may significantly deviate from signal prices during high volatility.
- Trend reversal risk: Fixed stop-loss may be insufficient for sudden strong trend reversals.
- Parameter dependency: Strategy performance is sensitive to MA periods and risk management parameter settings.
Optimization Directions
- Implement trend filters: Add indicators like ADX to trade only in strong trends.
- Dynamic stop-loss mechanism: Use ATR or volatility to adjust stop-loss levels dynamically.
- Volume confirmation: Include volume as a confirmatory indicator for trade signals.
- Adaptive parameter optimization: Dynamically adjust MA periods based on market volatility characteristics.
- Add trend strength filtering: Incorporate RSI or similar indicators to assess trend strength.
Summary
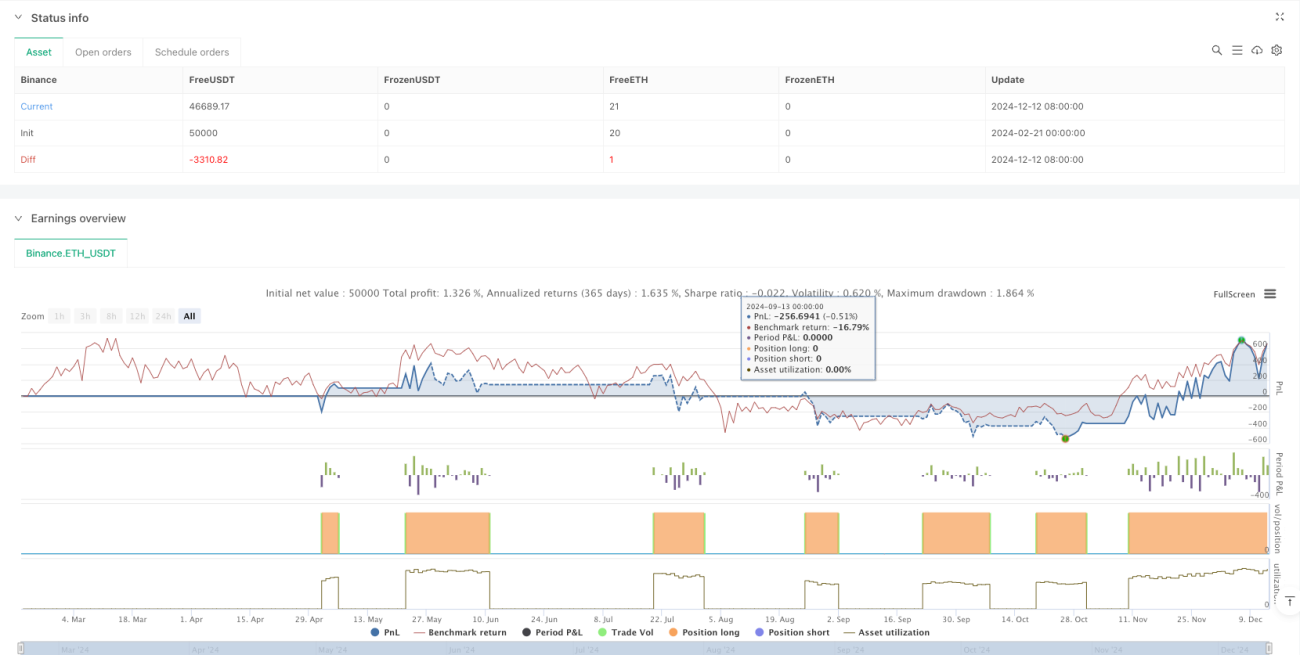
This strategy captures trends through dual MA crossovers while incorporating risk management mechanisms, forming a comprehensive trend-following trading system. While it may generate false signals in ranging markets, the strategy's stability and profitability can be enhanced through proper parameter optimization and additional confirmatory indicators. Its core strengths lie in high automation and robust risk control, making it suitable as a foundation for medium to long-term trend-following strategies.
- 1