Exponential Moving Average and Relative Strength Index Crossover Strategy

Overview
This strategy is a trading system based on the crossover of Exponential Moving Average (EMA) and Relative Strength Index (RSI). It determines entry and exit points through price-EMA crossovers and RSI overbought/oversold levels. The system incorporates comprehensive stop-loss and profit-taking mechanisms for effective risk management.
Strategy Principles
The strategy operates based on the following core logic:
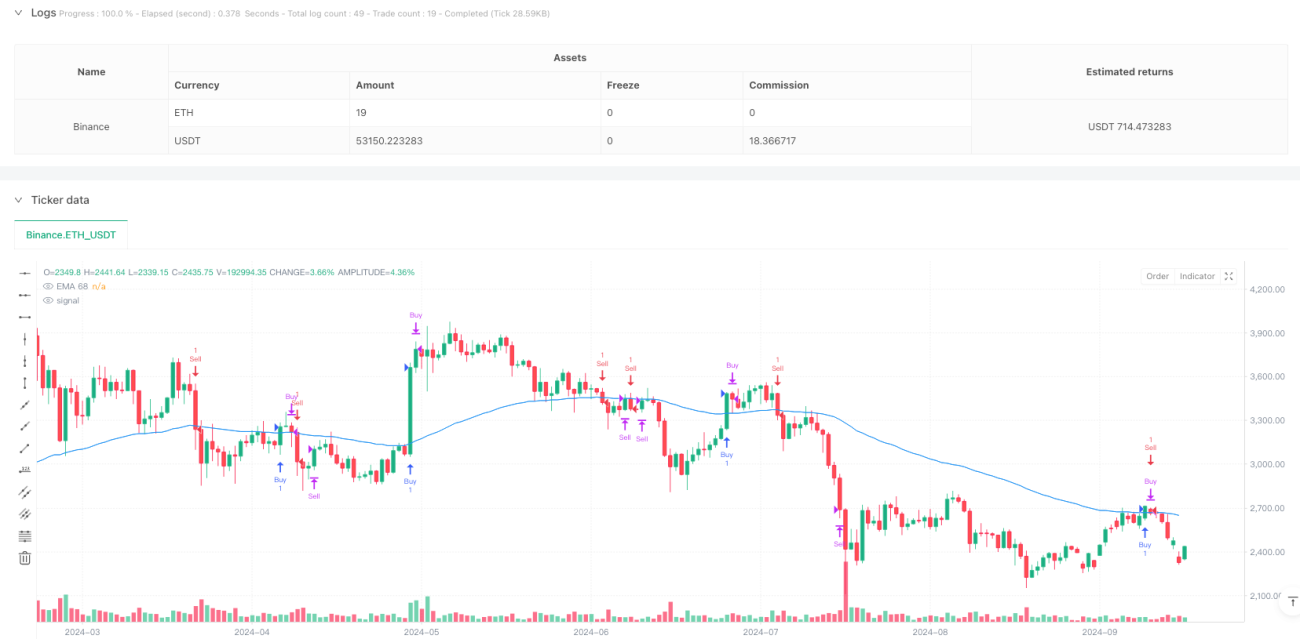
- Entry signals are generated based on price crossovers with offset EMA. A long signal occurs when price crosses above (EMA + offset); a short signal triggers when price crosses below (EMA - offset).
- Exit mechanism includes two dimensions: fixed-point stop-loss and RSI-based profit-taking. Long positions are closed at RSI 70, while short positions are closed at RSI 28.
- The system uses 68-period EMA for medium-term trend determination and 13-period RSI for short-term overbought/oversold identification.
Strategy Advantages
- Combines trend-following and oscillator indicators: Uses EMA for medium-term trend direction and RSI for capturing short-term market opportunities.
- Comprehensive risk control: Implements fixed-point stop-loss for effective single-trade risk management.
- Adjustable parameters: Core parameters including EMA period, RSI period, and crossover offset can be optimized for different market characteristics.
- Flexible profit-taking: Uses RSI indicator as profit criterion, allowing adaptive adjustment based on market volatility.
Strategy Risks
- Trend reversal risk: EMA's inherent lag during market trend changes may generate false signals.
- Unfavorable in ranging markets: Frequent crossovers during trendless periods may result in consecutive stops.
- Parameter sensitivity: Strategy performance is highly dependent on parameter settings, requiring frequent adjustments in different market environments.
Strategy Optimization Directions
- Add trend filter: Consider incorporating longer-period moving averages as trend filters, trading only when trend direction is clear.
- Dynamic stop-loss mechanism: Replace fixed-point stops with ATR-based dynamic stops for better volatility adaptation.
- Optimize entry timing: Integrate volume indicators to confirm crossover signals.
- Market environment recognition: Add volatility indicators to adjust trading parameters or pause trading in high-volatility environments.
Summary
The strategy combines classic technical indicators EMA and RSI to create a trading system featuring both trend-following and reversal characteristics. Its comprehensive risk control mechanisms and adjustable parameters ensure practical applicability. However, there remains room for improvement in parameter optimization and market adaptability, suggesting traders should conduct specific optimizations based on market characteristics during live implementation.
- 1