
Overview
This strategy is a comprehensive trading system that combines ICT (Internal Trader Concepts), engulfing patterns, and supply-demand zone analysis. It identifies high-probability trading opportunities through multi-dimensional market structure analysis, integrating technical indicators and price action. The strategy operates on a 15-minute timeframe and uses percentage-based stop-loss and take-profit levels for risk management.
Strategy Principles
The core logic is based on three main components:
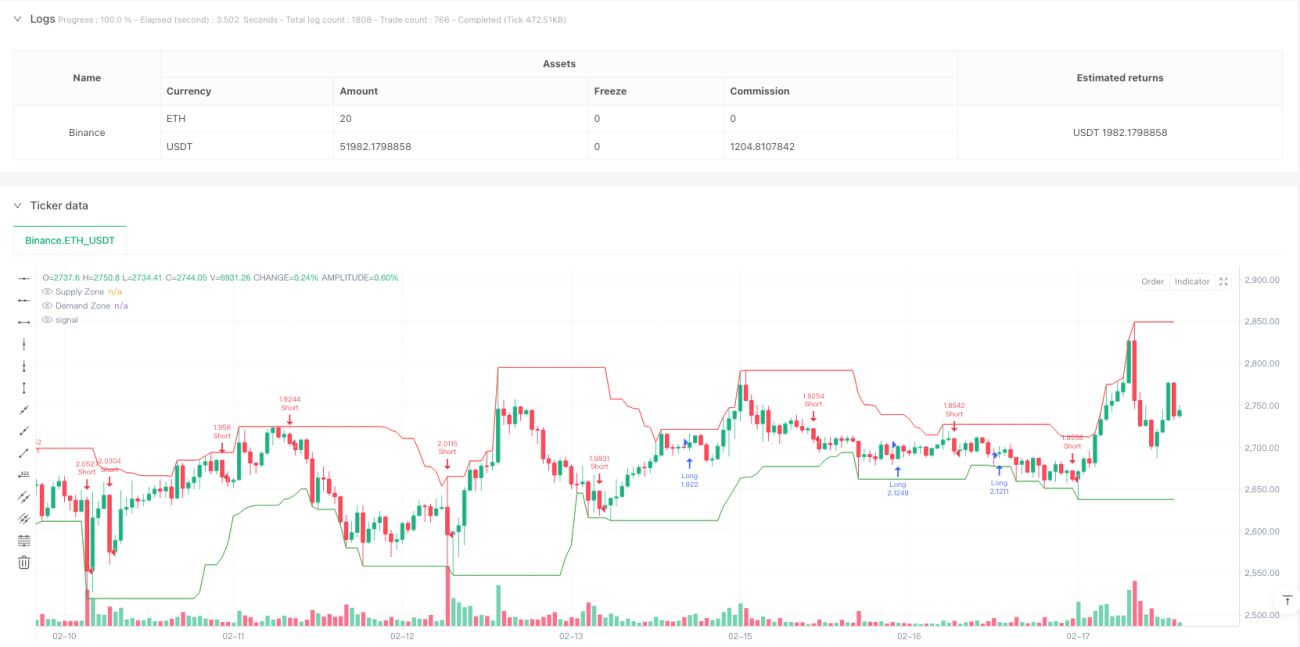
- Establishing supply and demand zones using 20-period high and low prices, which serve as significant support and resistance levels.
- Identifying bullish and bearish engulfing patterns by analyzing the relationship between adjacent candles.
- Executing trades when price breaks through supply/demand zones and engulfing patterns appear, with consideration for risk management.
The system uses 10% of equity for each trade, with a 1.5% stop-loss and 3% take-profit, providing a 2:1 risk-reward ratio.
Strategy Advantages
- Multi-dimensional analysis improves signal reliability
- Combination of price action and technical analysis reduces false signals
- Percentage-based stop-loss and take-profit adapt to different market conditions
- Reasonable money management system using 10% equity per trade reduces risk
- Parameters can be adjusted to adapt to different market environments
Strategy Risks
- May trigger frequent stop-losses in highly volatile markets
- Supply and demand zone identification might be inaccurate in certain market conditions
- 15-minute timeframe might generate too many trading signals
- Fixed percentage stop-loss and take-profit might not suit all market conditions
Risk Control Suggestions:
- Adjust parameters under different market conditions
- Consider adding confirmation indicators
- Dynamic adjustment of stop-loss and take-profit levels based on volatility
Strategy Optimization Directions
- Introduce volatility indicators for dynamic stop-loss and take-profit adjustment
- Add volume analysis to confirm signal strength
- Consider adding trend filters to reduce counter-trend trades
- Optimize supply and demand zone identification algorithm, possibly using multiple timeframe analysis
- Add market state recognition functionality to use different parameter sets under different market conditions
Summary
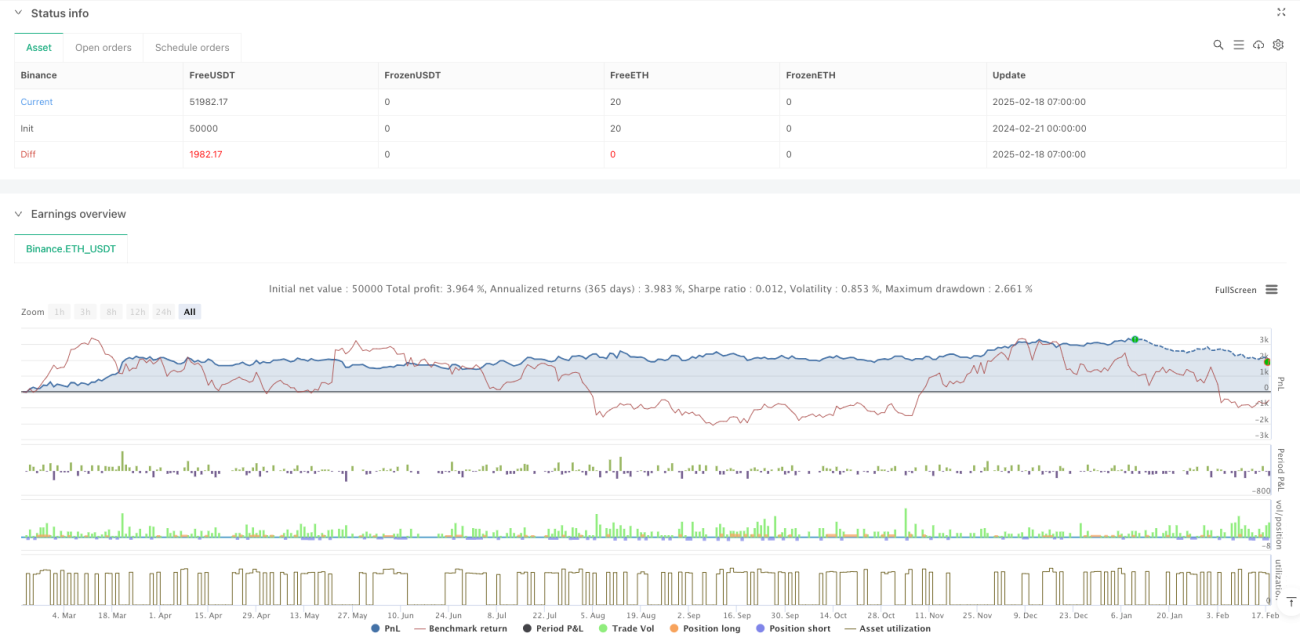
This is a well-structured comprehensive trading system that provides reliable trading signals through multi-dimensional analysis. The system's risk management is reasonable but has room for optimization. Traders are advised to thoroughly backtest before live trading and adjust parameters according to specific market conditions. The strategy's modular design provides good scalability, allowing for the addition of new analysis dimensions as needed.
/*backtest
start: 2024-02-21 00:00:00
end: 2025-02-18 08:00:00
period: 1h
basePeriod: 1h
exchanges: [{"eid":"Binance","currency":"ETH_USDT"}]
*/

//@version=5
strategy("ICT + Engulfing + Supply & Demand", overlay=true, default_qty_type=strategy.percent_of_equity, default_qty_value=10)

// Input settings- 1