Five-Minute Opening Breakout Strategy with Dynamic ATR-Based Stop-Loss and Take-Profit

Overview
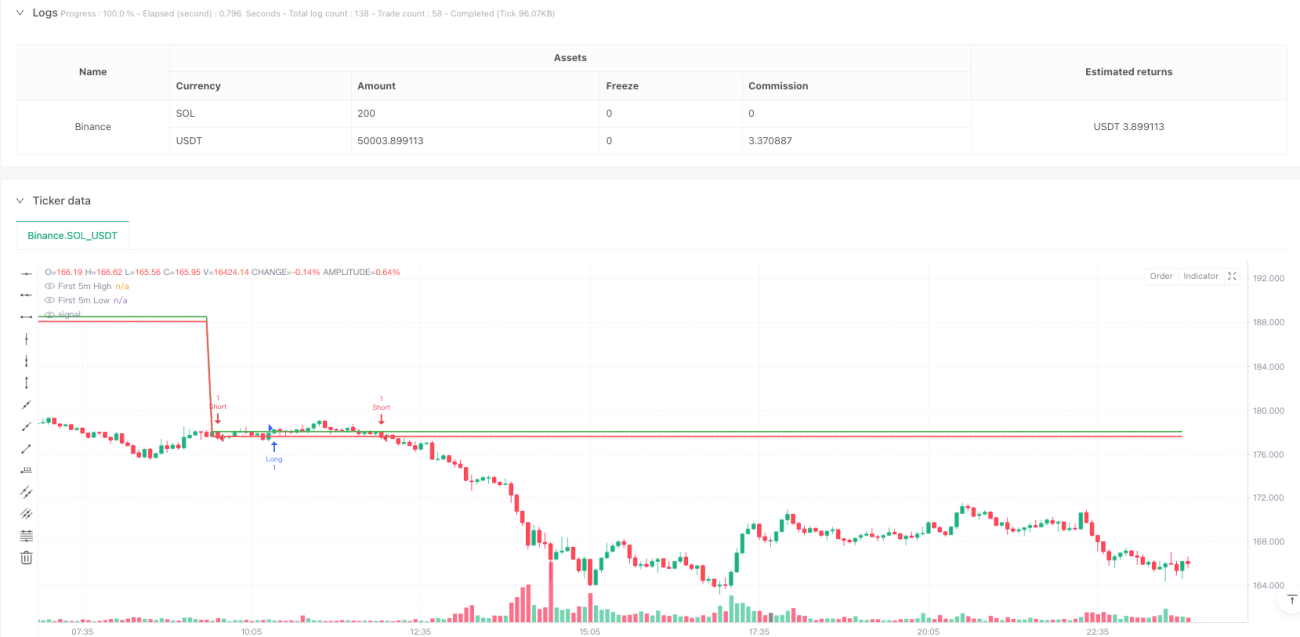
This strategy is a quantitative trading system based on five-minute opening breakout combined with dynamic ATR-based stop-loss management. It identifies key price levels from the first five-minute candle after market open, generates trading signals upon breakouts, and implements dynamic risk control using ATR-based stops.
Strategy Principles
The core logic includes the following key steps:
- Determine trading session start time (e.g., NYSE 9:30 AM)
- Capture the first five-minute candle, recording its open, high, and low prices
- Generate long signals on high breakout and short signals on low breakout
- Calculate volatility using 14-period ATR for dynamic stop-loss placement
- Implement 1:1.5 risk-reward ratio with stop-loss at 1x ATR and take-profit at 1.5x the breakout range
Strategy Advantages
- Precise Timeframe: Focuses on the most active five-minute period after market open
- Robust Risk Management: Dynamically adjusts stop-loss levels using ATR
- Standardized Execution: Uses clear breakout signals and fixed risk-reward ratio
- High Adaptability: ATR indicator automatically adjusts to market volatility
- Simple Implementation: Clear strategy logic facilitates testing and execution
Strategy Risks
- False Breakout Risk: Opening volatility may generate false signals
- Slippage Impact: High volatility periods may face significant slippage
- ATR Parameter Sensitivity: 14-period setting may not suit all market conditions
- Fixed Multiplier Limitation: 1:1.5 risk-reward ratio may need adjustment
- Transaction Cost Consideration: Frequent trading may incur high costs
Optimization Directions
- Signal Filtering: Incorporate volume confirmation or momentum indicators
- Parameter Adaptation: Develop dynamic ATR period adjustment mechanism
- Time Filtering: Add specific timeframe restrictions
- Stop-Loss Enhancement: Research market microstructure-based stop methods
- Instrument-Specific Optimization: Adjust risk-reward ratios per instrument
Summary
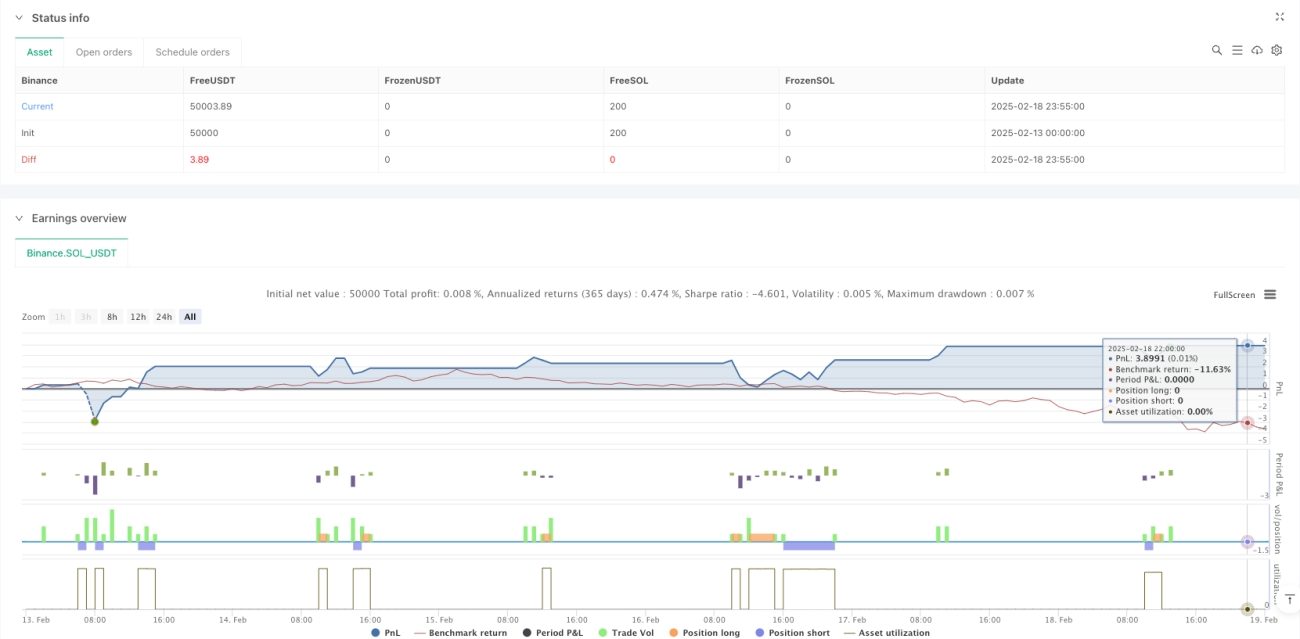
This is a well-structured quantitative trading strategy that achieves controlled risk automated trading through opening price breakout monitoring and ATR dynamic stops. Its core strength lies in its simple yet effective design, though it requires continuous optimization for different market environments and instruments. Traders should conduct thorough backtesting and adjust parameters according to actual conditions before live implementation.
- 1