
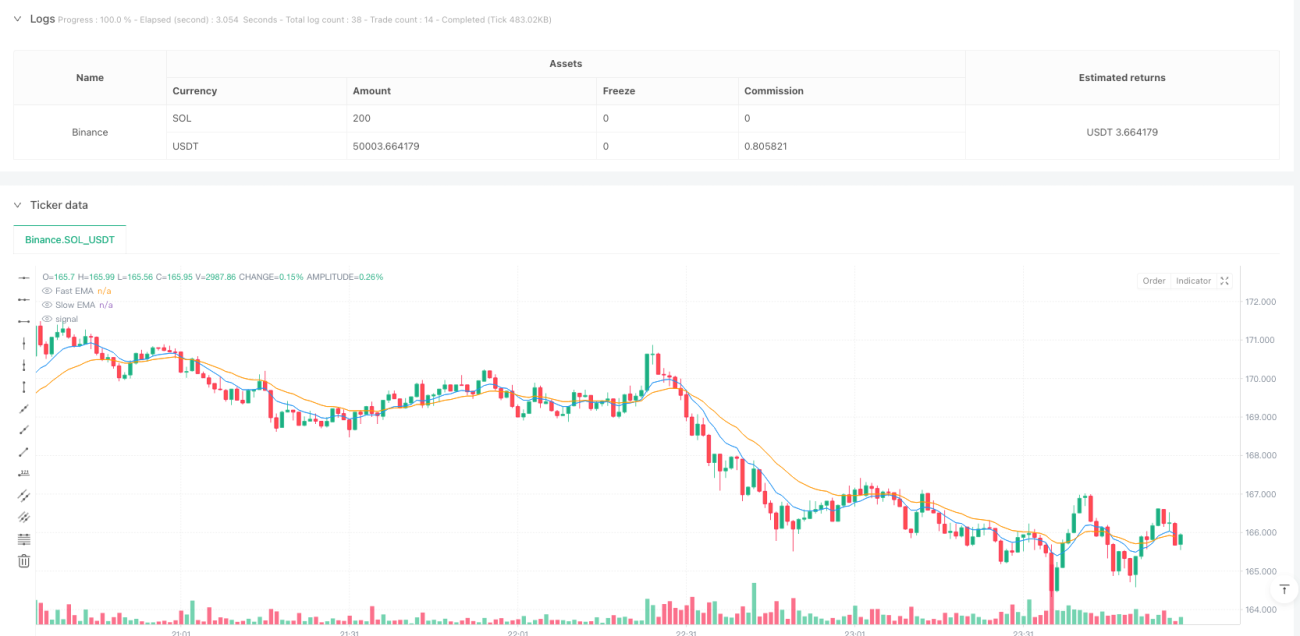
Overview
This is a trend trading strategy based on multiple technical indicator confirmations, combining moving averages, momentum indicators, and volume analysis for trade signal filtering. The strategy employs a triple-layer filtering mechanism, including trend direction determination (EMA crossover), momentum strength confirmation (RSI and MACD), and volume validation (volume breakout and OBV trend), equipped with an ATR-based risk control system.
Strategy Principles
The strategy operates on a triple confirmation mechanism:
- Trend Confirmation Layer: Uses 9 and 21-period Exponential Moving Average (EMA) crossovers to determine overall trend direction, with fast line crossing above slow line indicating uptrend and vice versa.
- Momentum Confirmation Layer: Combines RSI and MACD momentum indicators. Bullish momentum is confirmed when RSI is above 50 and MACD shows golden cross, bearish momentum when RSI is below 50 and MACD shows death cross.
- Volume Confirmation Layer: Requires volume spike of 1.8 times above average, while validating price-volume relationship through OBV trend.
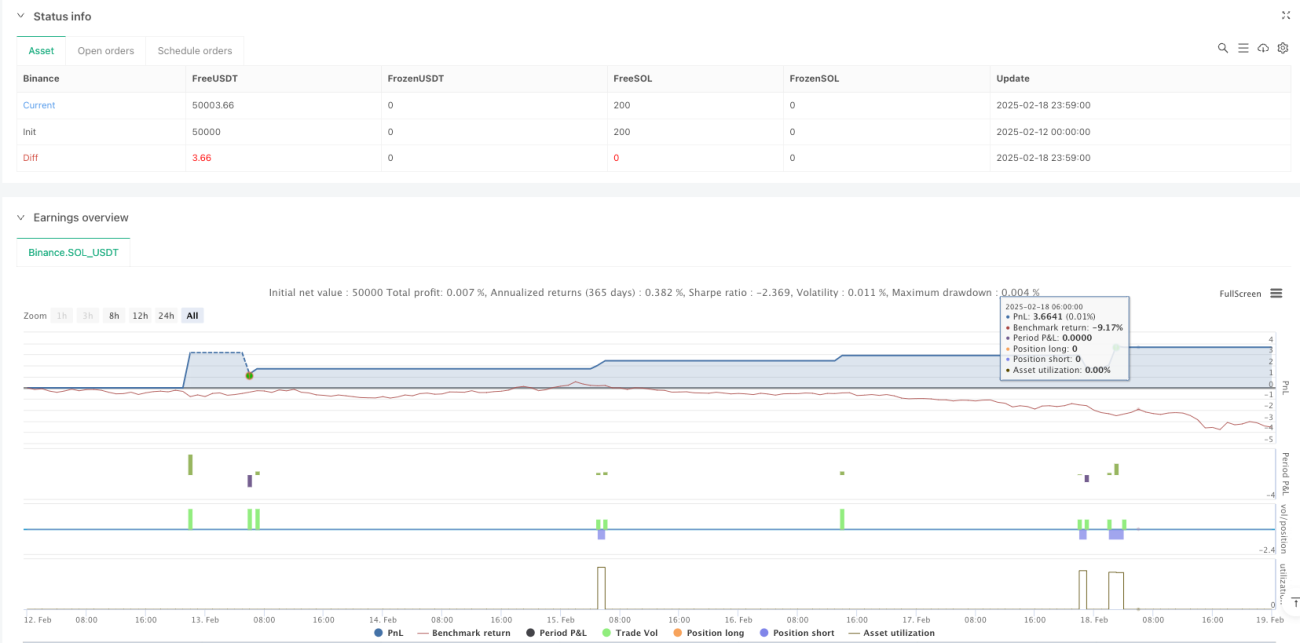
Risk management employs 1.5x ATR for stop-loss levels with a default 1:2 risk-reward ratio for profit targets.
Strategy Advantages
- Multi-layer filtering mechanism significantly improves trade signal reliability and reduces false signals.
- Combines trend, momentum, and volume dimensions for comprehensive market state evaluation.
- ATR-based dynamic stop-loss settings adapt to market volatility.
- Strategy includes visualization tools for intuitive entry timing.
- Provides optimization parameters for assets with different volatility levels.
Strategy Risks
- Multiple filtering conditions may cause missed opportunities.
- May generate frequent false breakout signals in ranging markets.
- Fixed risk-reward ratio might lack flexibility in certain market conditions.
- Volume dependency may generate misleading signals during low liquidity periods.
- EMA parameters require adjustment for different market states.
Strategy Optimization Directions
- Introduce adaptive indicator parameters: Dynamically adjust EMA and RSI periods based on market volatility.
- Optimize volume judgment: Consider implementing relative volume indicators to reduce abnormal volume impact.
- Improve risk management: Implement dynamic risk-reward ratio adjustment based on market volatility.
- Add market environment filtering: Incorporate trend strength indicators, using trailing stops during strong trends.
- Enhance exit mechanism: Develop more flexible exit conditions by integrating additional technical indicators.
Summary
This is a well-designed multi-layer confirmation trading strategy that provides relatively reliable trading signals through the combination of multiple technical indicators. While the strategy's risk management system is quite comprehensive, traders still need to optimize parameters according to specific market conditions. The strategy is best suited for markets with moderate volatility and sufficient liquidity, requiring traders to have a solid foundation in technical analysis.
- 1