Dynamic EMA Crossover with Adaptive Swing High-Low Strategy

Overview
This strategy is a trading system based on the 22-period Exponential Moving Average (EMA) crossover signals and swing points. It generates trading signals through price-EMA crossovers and utilizes adaptive swing highs and lows for setting profit targets and stop losses. This approach ensures both trend-following functionality and flexible risk management.
Strategy Principles
The core logic includes several key elements:
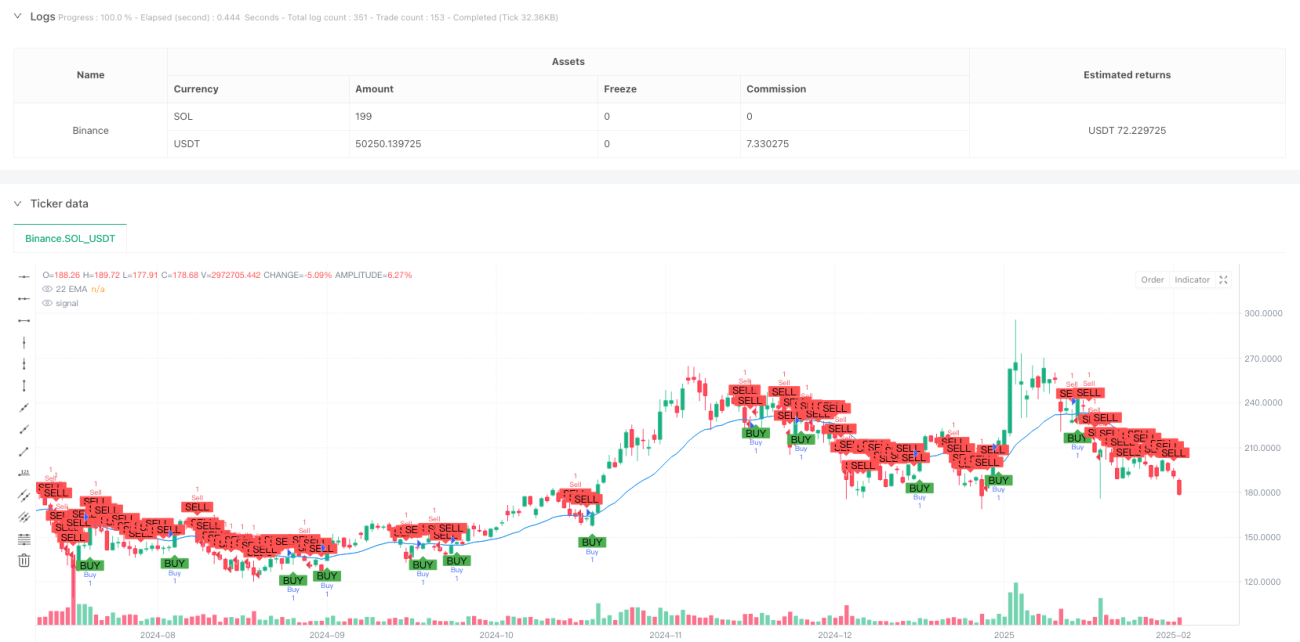
- Uses 22-period EMA as the main trend indicator, effectively filtering market noise
- Triggers long signals when price closes above EMA, and short signals when below
- Calculates swing highs and lows using 14-period historical data
- Sets profit targets at recent swing highs and stop losses at swing lows for long trades
- Sets profit targets at recent swing lows and stop losses at swing highs for short trades
Strategy Advantages
- Strong trend adaptability: 22-period EMA effectively captures medium-term trends, avoiding excessive trading
- Dynamic risk management: Profit targets and stop losses automatically adjust to market volatility
- Clear execution: Trading signals are unambiguous with no grey areas
- Reasonable risk-reward ratio: Swing points ensure relatively stable risk-reward ratios for each trade
- Good visualization: Strategy provides clear visual signals for easy monitoring and understanding
Strategy Risks
- Choppy market risk: May generate frequent false breakout signals in ranging markets
- Slippage risk: Actual execution prices may significantly deviate from signal prices during volatile periods
- Gap risk: Market gaps may render stops ineffective, causing unexpected losses
- Trend reversal risk: May experience consecutive losses near major trend reversal points
Optimization Directions
- Incorporate volume indicators: Can confirm signal reliability through volume analysis
- Add trend filters: Combine with longer-period moving averages to filter counter-trend signals
- Optimize stop loss methodology: Consider using ATR for dynamic stop loss adjustment
- Implement time filters: Restrict trading during highly volatile periods
- Develop signal confirmation mechanism: Integrate other technical indicators for signal confirmation
Summary
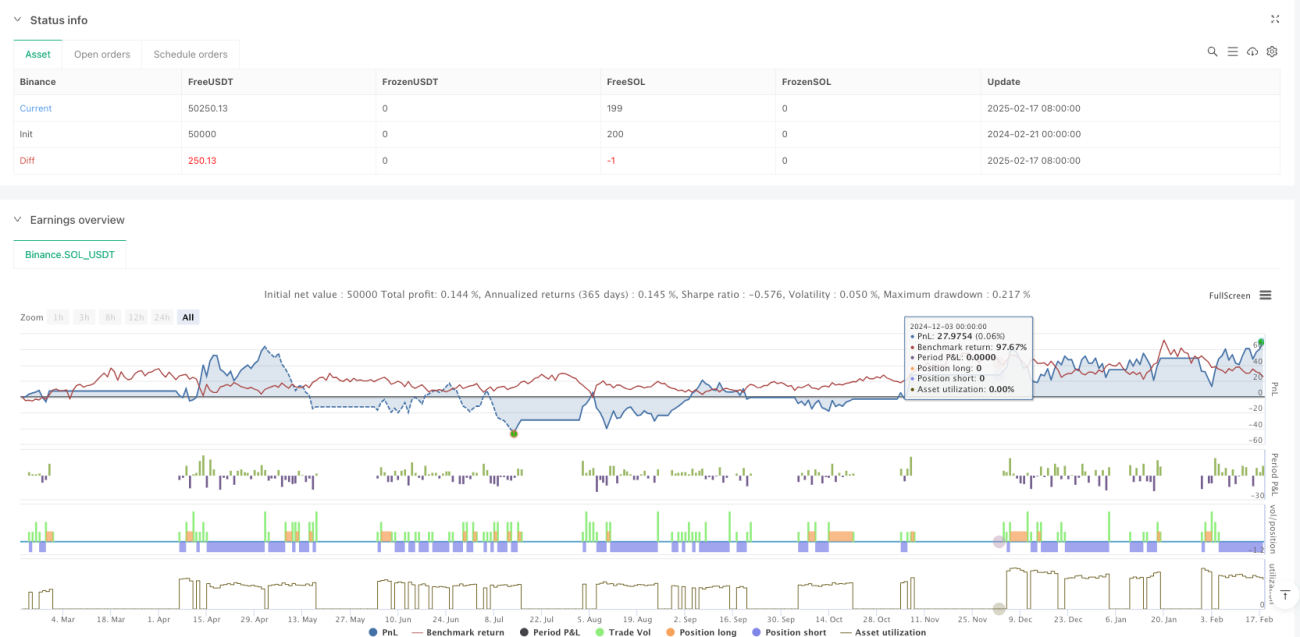
This is a well-structured trend-following strategy with clear logic. It generates trading signals through EMA crossovers and manages risk using swing points, forming a balanced trading system. The strategy's main advantage lies in its ability to dynamically adapt to market conditions, while its primary risks come from sudden market state changes. Through the suggested optimization directions, the strategy's stability and profitability can be further enhanced.
- 1