
Overview
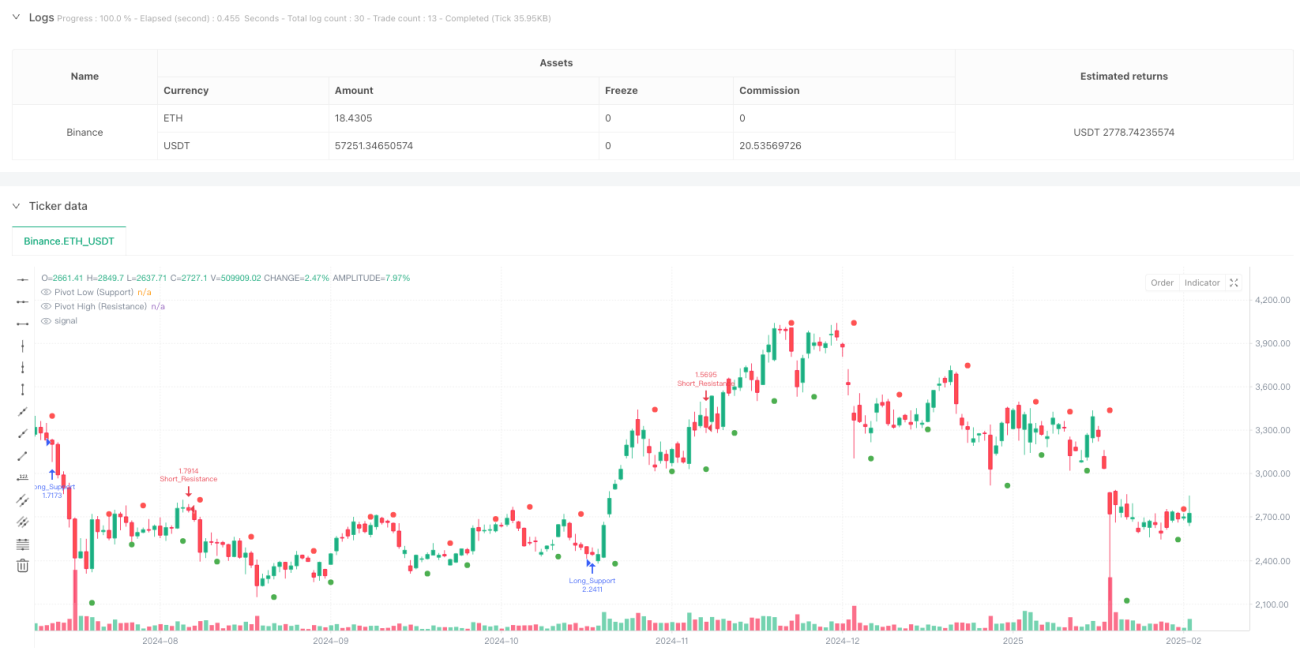
This is a quantitative trading strategy based on support-resistance breakout and retest. The strategy identifies key price support and resistance levels, executing trades at retest confirmation points after breakouts. It uses dynamic left and right bar lookback to locate key levels and incorporates retest tolerance to filter false breakouts, thereby improving trading accuracy and stability.
Strategy Principles
The strategy includes the following core logic:
- Identifies key support and resistance pivot points using specified left and right bar lookback
- Uses state variables to track breakout and retest situations for candidate support-resistance levels
- Updates candidate support-resistance levels when new pivot points appear
- Executes trades when price breaks and retests candidate support-resistance levels:
- Goes long when price drops below support and rebounds near support
- Goes short when price breaks above resistance and falls back near resistance
- Uses tolerance parameter to filter price fluctuations during retests, improving signal quality
Strategy Advantages
- Based on classic technical analysis theory, clear and easy to understand
- Strong adaptability through dynamic key level identification
- Reduces false signals by combining breakout and retest confirmation
- Filters noise using tolerance parameters, improving accuracy
- Clear code structure, easy to maintain and extend
- Applicable to multiple timeframes and instruments
Strategy Risks
- May result in losses from frequent trading in ranging markets
- False breakout signals still exist
- Parameter optimization may lead to overfitting
- Large stop losses possible during high market volatility
- Need to consider impact of trading costs
Strategy Optimization Directions
- Add trend filter to trade only in primary trend direction
- Incorporate volume confirmation mechanism
- Optimize entry timing by adding technical indicator confirmation
- Improve stop loss and take profit mechanism
- Add position management logic
- Consider multi-timeframe analysis
Summary
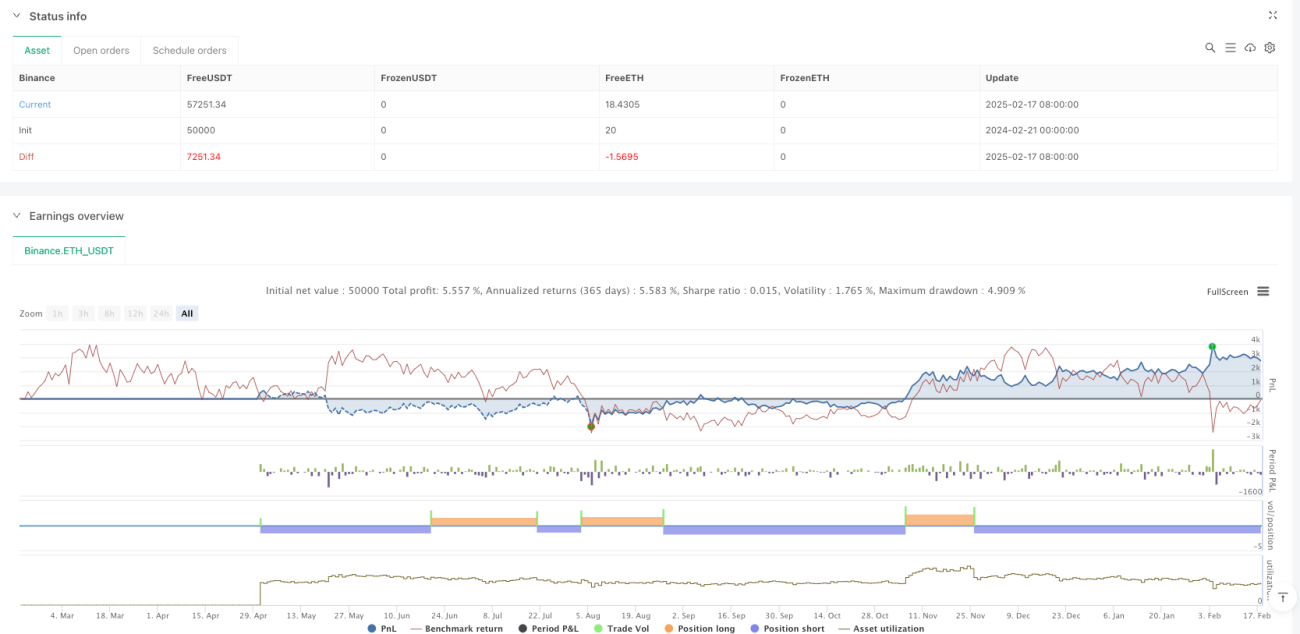
The strategy is built on classic support-resistance theory and breakout-retest logic with a solid theoretical foundation. Stable trading results can be achieved through parameter optimization and risk control. The strategy code structure is clear, easy to understand and extend, with strong practical value. It is recommended to adjust parameters appropriately in live trading based on market conditions and personal risk preference.
/*backtest
start: 2024-02-21 00:00:00
end: 2025-02-18 08:00:00
period: 1d
basePeriod: 1d
exchanges: [{"eid":"Binance","currency":"ETH_USDT"}]
*/

//@version=5
strategy("SR Breakout & Retest Strategy (4hr)", overlay=true, initial_capital=10000, default_qty_type=strategy.percent_of_equity, default_qty_value=10)

// ===== USER INPUTS =====- 1