
Overview
This strategy is a comprehensive trading system that combines the Parabolic SAR indicator, SuperTrend indicator, and Volume Oscillator. The strategy confirms market trends through multiple technical indicators, enhancing trading signal reliability through cross-validation. The core design philosophy is to confirm signals across three dimensions: trend, momentum, and volume, only executing trades when all three dimensions show consistent signals.
Strategy Principles
The strategy employs three core indicators:
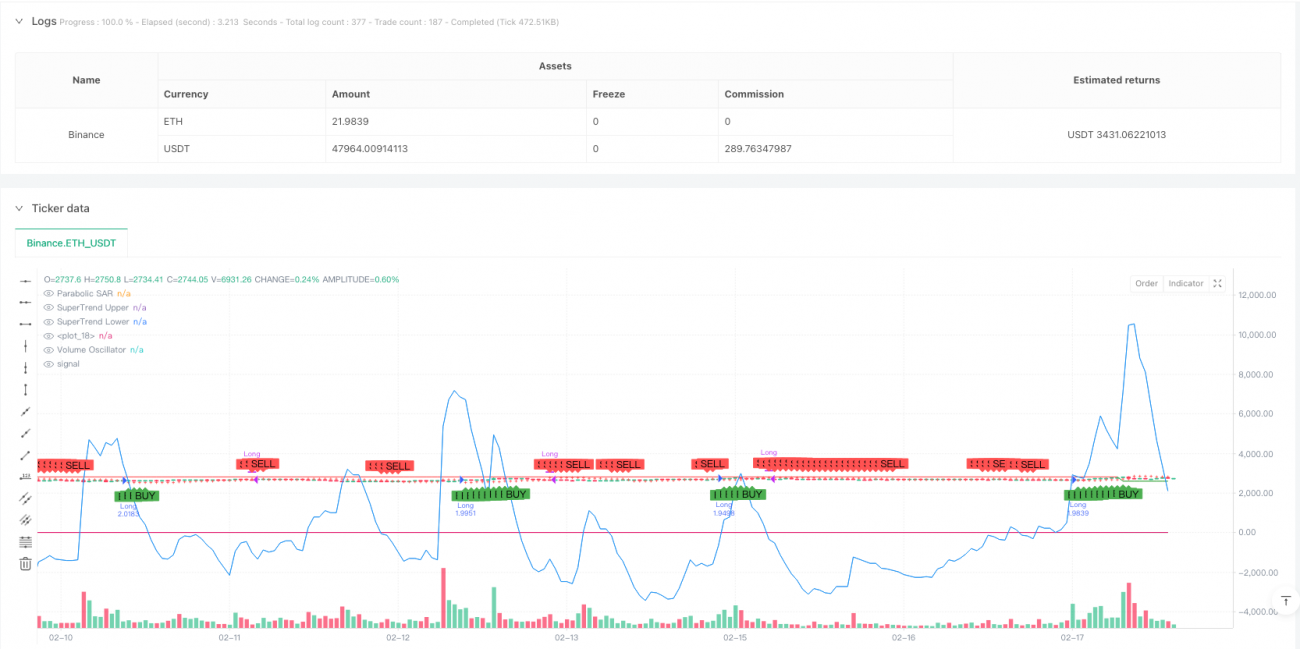
- Parabolic SAR (Start 0.02, Acceleration 0.02, Maximum 0.2): Identifies trend reversal points. Bullish when price is above SAR points, bearish when below.
- SuperTrend (Period 10, Multiplier 3): Generates dynamic trend channels using ATR volatility. Produces buy signals on upper band breakouts and sell signals on lower band breakouts.
- Volume Oscillator (Short 14, Long 28): Measures trading activity by comparing short-term and long-term volume moving averages. Positive values indicate increasing volume, negative values indicate decreasing volume.
Signal Generation Logic:
- Buy Condition: Price above SAR + Bullish SuperTrend (price above lower band) + Positive Volume Oscillator
- Exit Condition: Price below SAR + Bearish SuperTrend (price below upper band) + Negative Volume Oscillator
Strategy Advantages
- Multi-dimensional Confirmation: Validates trading signals through price trend, dynamic channels, and volume, significantly reducing false breakout risks.
- Dynamic Adaptation: SuperTrend adjusts channel width based on ATR, better adapting to varying market volatility conditions.
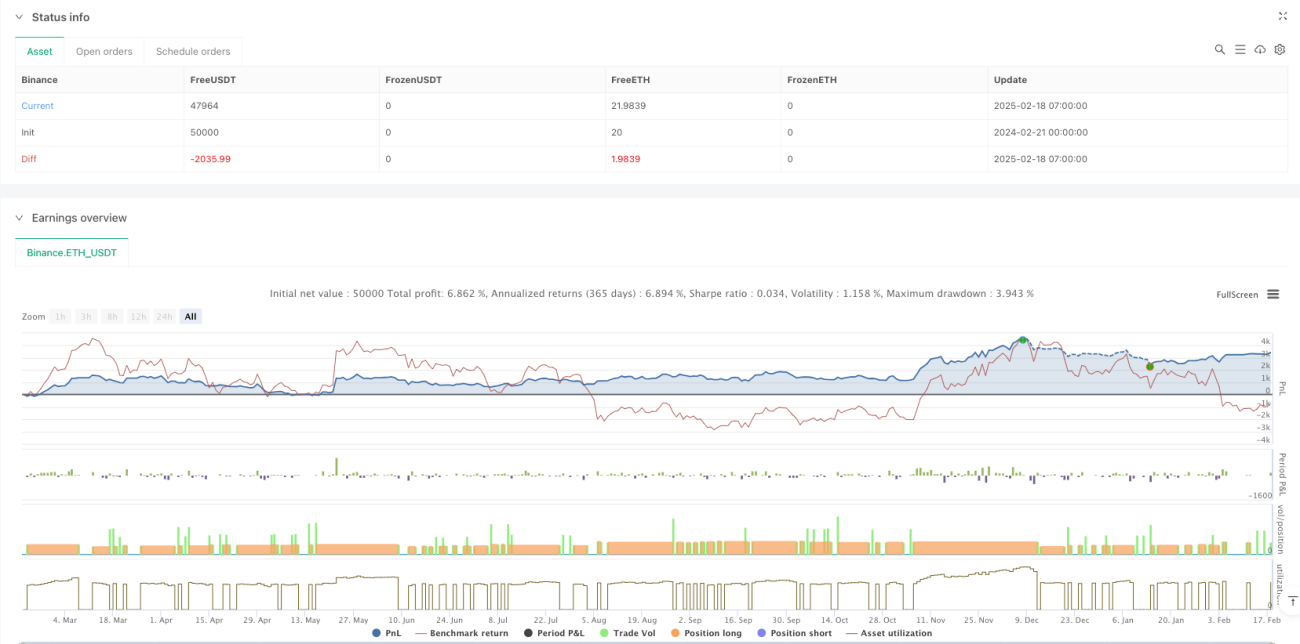
- Risk Control: Implements percentage-based position sizing (set at 10% of equity), effectively controlling risk exposure per trade.
- Visualization: Provides clear visual feedback including SAR points, trend clouds, and trade signal markers.
Strategy Risks
- Ranging Market Risk: May generate frequent false signals in sideways markets, leading to consecutive stops.
- Lag Risk: Due to multiple moving average-based indicators, signals have inherent lag, potentially missing optimal entry points.
- Parameter Sensitivity: Strategy performance is sensitive to parameter settings, different market conditions may require different parameter combinations.
- Cost Impact: Frequent trading may incur high transaction costs, affecting overall returns.
Strategy Optimization Directions
- Market Environment Filter: Recommend adding market environment recognition module to reduce position size or pause trading in ranging markets.
- Dynamic Parameter Optimization: Automatically adjust SuperTrend parameters based on market volatility to improve adaptability.
- Stop Loss Optimization: Add trailing stop functionality to secure profits during trend reversals.
- Time-based Optimization: Adjust signal trigger thresholds based on characteristics of different trading sessions.
- Cost Control: Implement holding time restrictions to avoid excessive trading frequency.
Summary
This strategy builds a relatively complete trading system by combining trend following and volume analysis. Its main feature is using multiple indicator confirmation to enhance trading reliability while providing traders with intuitive decision references through visualization. Although it has certain lag and parameter sensitivity issues, the strategy has good practical value through proper optimization and risk control measures. Traders are advised to find suitable parameter combinations through backtesting before live trading and make flexible adjustments based on market experience.
//@version=5
strategy("Parabolic SAR + SuperTrend + Volume Oscillator Strategy", overlay=true, default_qty_type=strategy.percent_of_equity, default_qty_value=10)

// --- Parabolic SAR Parameters ---
sar_start = 0.02
sar_increment = 0.02
sar_max = 0.2
sar = ta.sar(sar_start, sar_increment, sar_max)
plot(sar, color=color.red, style=plot.style_cross, title="Parabolic SAR")

// --- SuperTrend Parameters ---
st_length = 10- 1