
Overview
This strategy is a trend following system that combines a dual moving average crossover with the Relative Strength Index (RSI). It captures market trends through the crossover of 9-period and 21-period Exponential Moving Averages (EMA), while using RSI for overbought/oversold filtering and volume confirmation to enhance signal reliability. The strategy also incorporates a dynamic stop-loss mechanism based on Average True Range (ATR) for comprehensive risk control.
Strategy Principles
The core logic is based on several key elements:
- Using fast EMA (9-period) and slow EMA (21-period) crossovers to identify potential trend changes
- Filtering through RSI indicator, allowing trades only when RSI is between 40-60
- Setting minimum volume threshold (100,000) as trade confirmation
- Implementing 1.5x ATR as dynamic stop-loss distance for flexible risk control
Long signals are generated when the fast EMA crosses above the slow EMA, RSI is above 40, and volume exceeds the threshold. Conversely, short signals occur when the fast EMA crosses below the slow EMA, RSI is below 60, and volume confirms.
Strategy Advantages
- Scientific indicator combination: integrating trend following, momentum, and volume analysis
- Comprehensive risk control: multi-level risk management through RSI filtering and dynamic stops
- Flexible parameters: key parameters can be optimized for different market characteristics
- Strict signal confirmation: multiple conditions required, effectively reducing false signals
- Clear execution logic: explicit rules facilitating live trading and backtesting
Strategy Risks
- Frequent trades in ranging markets: multiple crossovers during consolidation
- RSI filter may miss trend beginnings: RSI might be high at strong trend initiation
- Volume filter might be too strict: challenging for low liquidity instruments
- Fixed multiplier ATR stops may lack flexibility during extreme volatility
- Absence of fixed take-profit levels may affect capital efficiency
Optimization Directions
- Introduce adaptive parameters: dynamically adjust EMA periods and RSI thresholds based on volatility
- Optimize stop-loss mechanism: implement multi-level stops using support/resistance
- Add market environment filtering: incorporate trend strength indicators
- Improve money management: adjust position sizes based on signal strength and volatility
- Add take-profit mechanism: implement ATR-based dynamic take-profit levels
Summary
The strategy constructs a logically rigorous trend following system through scientific combination of classic technical indicators. Its multiple filtering mechanisms and risk control measures provide strong practical value. There's room for further improvement through the suggested optimizations. It's particularly suitable for volatile and liquid markets, but requires thorough testing and parameter optimization before implementation.
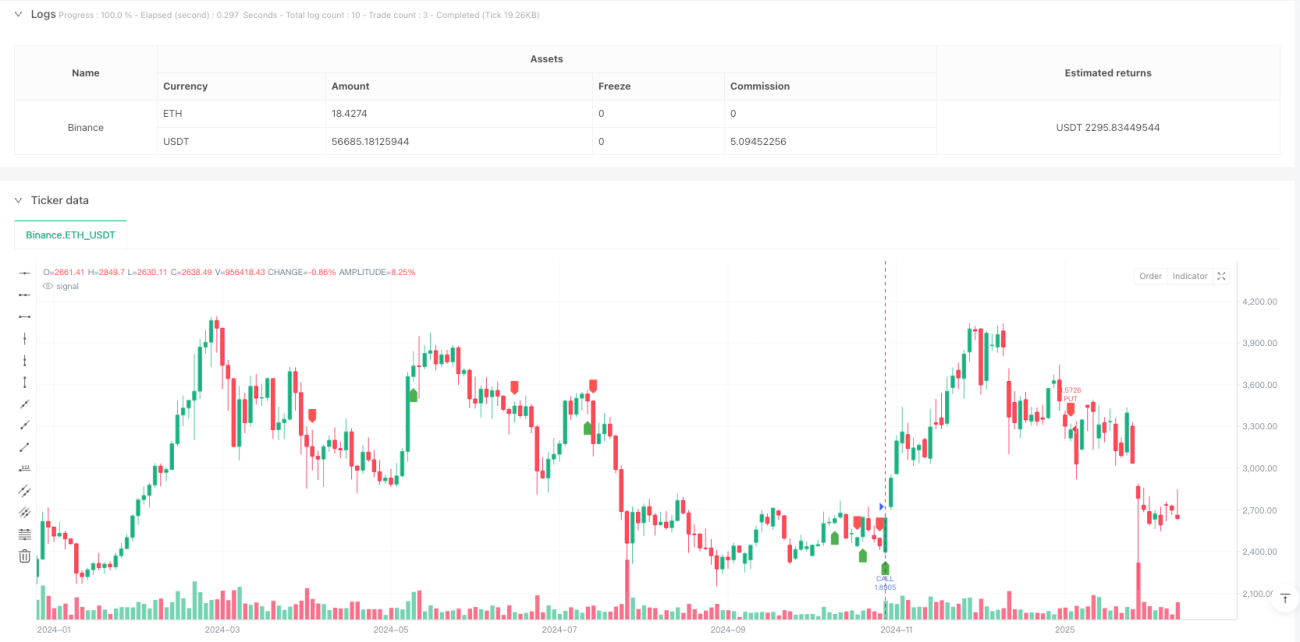
/*backtest
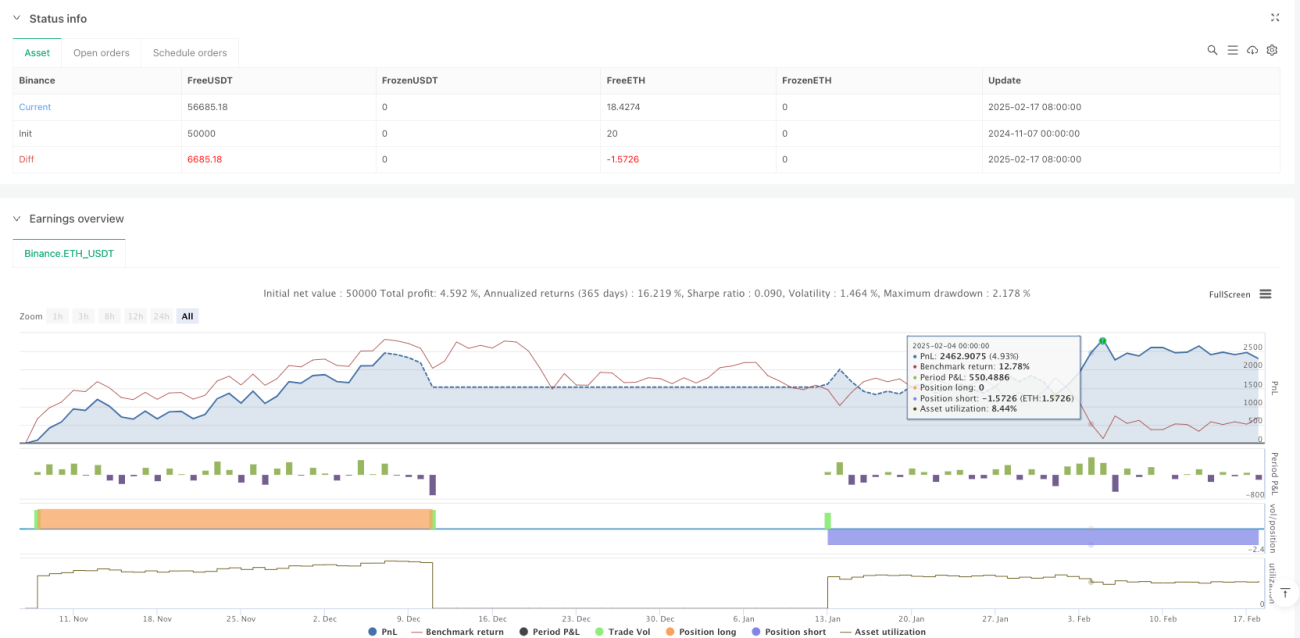
start: 2024-11-07 00:00:00
end: 2025-02-18 08:00:00
period: 2d
basePeriod: 2d
exchanges: [{"eid":"Binance","currency":"ETH_USDT"}]
*/
//@version=5
strategy("Call & Put Options Strategy (Optimized)", overlay=true, default_qty_type=strategy.percent_of_equity, default_qty_value=10)
// 📌 Configuration Parameters- 1