Triple Bollinger Band Standard Deviation Trend Following Strategy

Overview
This strategy is a trend following trading system based on Bollinger Band standard deviation. It determines trend strength by observing the relationship between three consecutive candles and the Bollinger Bands, executing trades when trends are confirmed. The system employs a fixed risk-reward ratio for managing trade risk.
Strategy Principle
The core logic is based on the following points:
- Uses a 20-period moving average as the middle band, with 2 standard deviations for upper and lower bands.
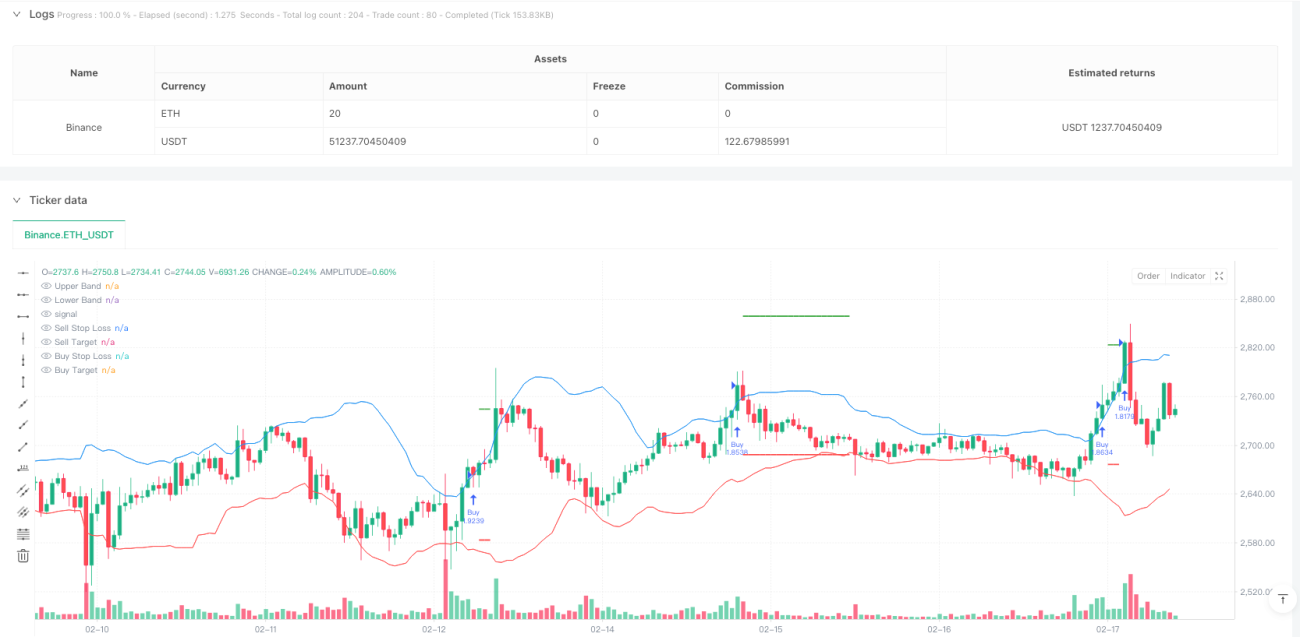
- When three consecutive candles close above the upper band, an uptrend is confirmed, entering long at the close of the third candle.
- When three consecutive candles close below the lower band, a downtrend is confirmed, entering short at the close of the third candle.
- Stop loss is set at the extreme value of the earliest candle in the entry signal.
- Target price is set with a 1:1 risk-reward ratio, meaning the profit target distance equals the stop loss distance.
Strategy Advantages
- Robust Signal Confirmation - Requires three consecutive candles breaking the Bollinger Bands, effectively reducing false breakout risks.
- Rational Risk Management - Uses fixed risk-reward ratio for trade management, preventing excessive losses in single trades.
- Effective Trend Following - Bollinger Band's standard deviation characteristics allow the strategy to adapt to market volatility changes.
- Clear Execution Rules - Entry, stop loss, and profit targets all have clear quantitative standards, requiring no subjective judgment.
Strategy Risks
- Poor Performance in Ranging Markets - May generate frequent false signals in markets without clear trends.
- Delayed Entry Timing - Waiting for three-candle confirmation may miss early stages of price movements.
- Fixed Risk-Reward Ratio Limitations - 1:1 risk-reward ratio may close profitable positions too early in strong trends.
- Lack of Trend Strength Filtering - Relies solely on price-band relationships without considering other trend confirmation indicators.
Strategy Optimization Directions
- Add Trend Strength Filter - Incorporate ADX or MACD for improved signal quality.
- Optimize Risk-Reward Ratio Setting - Dynamically adjust risk-reward ratio based on market volatility.
- Enhance Profit-Taking Mechanism - Consider adding trailing stops or partial profit-taking mechanisms for better trend capture.
- Include Volume Confirmation - Add volume breakout confirmation when generating signals to improve reliability.
Summary
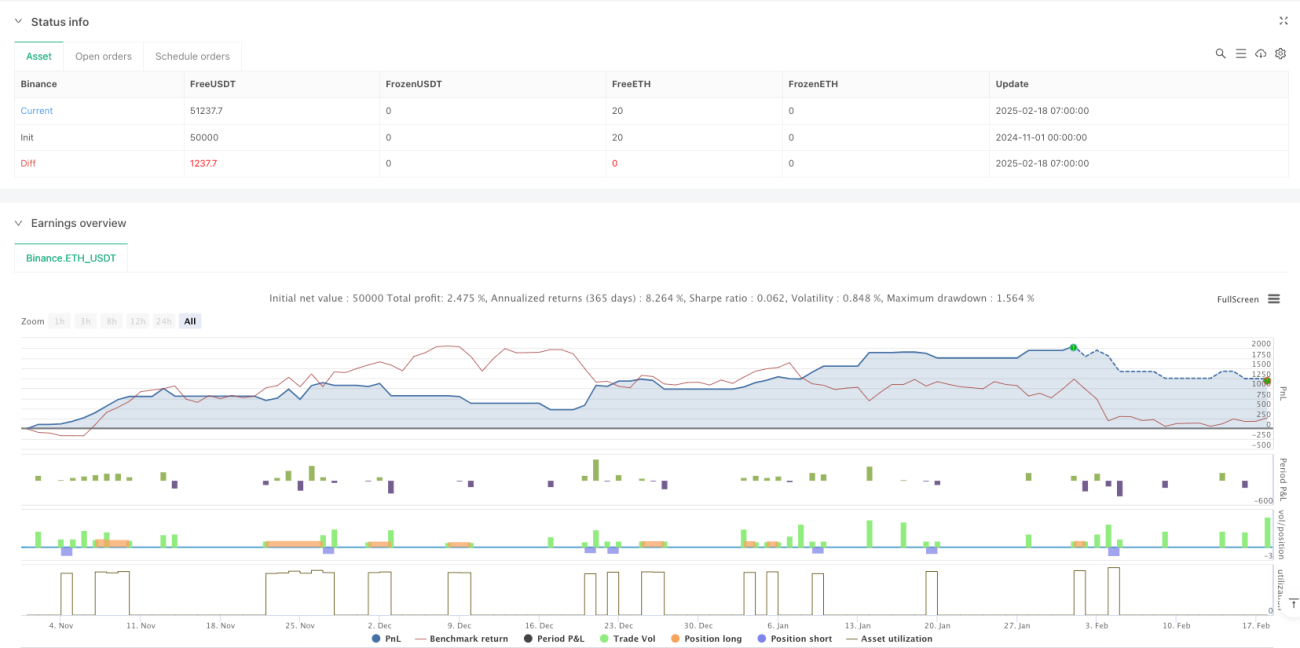
This is a well-designed trend following strategy that captures market trends through Bollinger Bands and multiple confirmation mechanisms. The strategy features a comprehensive risk management framework with clear execution standards. While there is some inherent lag, the suggested optimization directions can further enhance strategy stability and profitability. For traders who prefer trend following and emphasize risk control, this provides a valuable strategic framework.
/*backtest
start: 2024-11-01 00:00:00
end: 2025-02-18 08:00:00
period: 1h
basePeriod: 1h
exchanges: [{"eid":"Binance","currency":"ETH_USDT"}]
*/

//@version=6
strategy("Bollinger Band Buy and Sell Strategy (Entry at Close of 3rd Candle)", overlay=true, default_qty_type=strategy.percent_of_equity, default_qty_value=10, pyramiding=0)

// Bollinger Band settings- 1