Multi-Indicator Trend Following Strategy with ADX Dynamic Trading System

EMA RSI ADX ATR SL/TP
Created on: 2025-02-20 16:20:04 Modified on: 2025-02-20 16:20:04
Copy: 2 Number of hits: 320
avatar of ianzeng123 ianzeng123
2
Follow
319
Followers

 Multi-Indicator Trend Following Strategy with ADX Dynamic Trading System  Multi-Indicator Trend Following Strategy with ADX Dynamic Trading System

Overview

This strategy is a comprehensive trading system that combines multiple technical indicators including Exponential Moving Average (EMA), Relative Strength Index (RSI), and Average True Range (ATR), while incorporating the Average Directional Index (ADX) to enhance trend identification accuracy. The system confirms entry points through multiple signals and utilizes ATR for dynamic stop-loss and take-profit management.

Strategy Principles

The core strategy captures market trends through multiple technical indicators: 1. Uses fast (20-period) and slow (50-period) EMAs to determine trend direction 2. Incorporates ADX (14-period) to confirm trend strength, requiring ADX>20 for valid trends 3. Utilizes RSI (14-period) to identify overbought/oversold opportunities, triggering buys above 30 and sells below 70 4. Employs ATR (14-period) for dynamic stop-loss and take-profit levels, with a 2:1 risk-reward ratio

Strategy Advantages

  1. Multiple signal confirmation reduces false signals
  2. ADX integration enhances trend identification reliability
  3. Dynamic stop-loss and take-profit mechanism adapts to market volatility
  4. Strict risk control ensures manageable risk per trade
  5. Clear strategy logic with adjustable parameters

Strategy Risks

  1. Multiple indicators may lead to delayed signals
  2. Frequent trading may occur in ranging markets
  3. ADX indicator may generate delayed signals in certain market conditions
  4. Parameters require optimization for different market environments

Strategy Optimization

  1. Consider adding volume indicators to enhance signal reliability
  2. Implement volatility filters to adjust positions during high volatility periods
  3. Develop adaptive parameter mechanisms based on market conditions
  4. Add trend strength classification for dynamic position management
  5. Optimize stop-loss and take-profit logic with trailing stops

Summary

This strategy builds a comprehensive trend-following trading system through the organic combination of multiple technical indicators. While ensuring trading accuracy, it maintains safety through strict risk control. Although there is room for optimization, the overall framework provides practical value and extensibility.
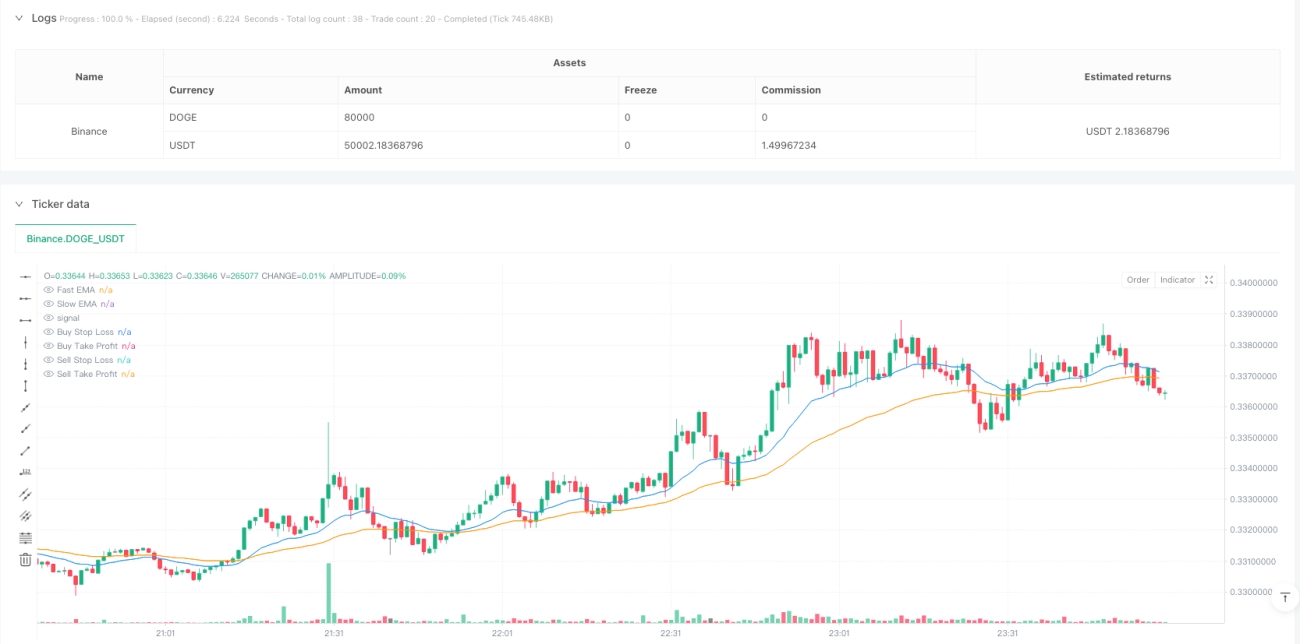
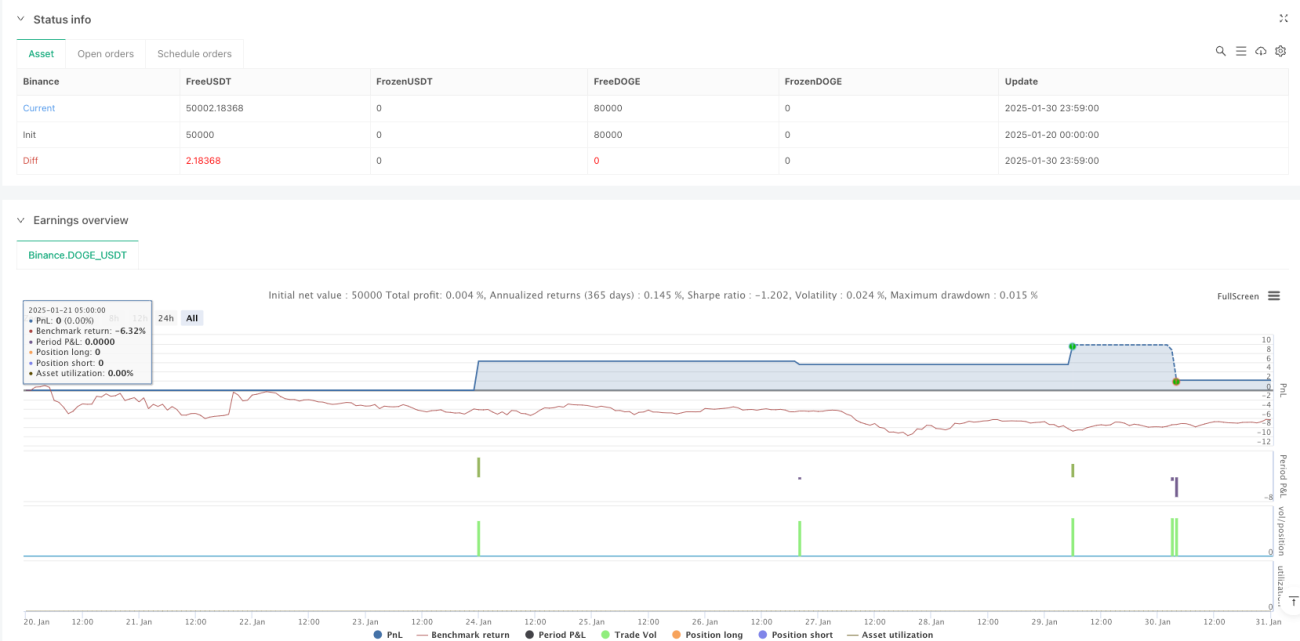
Strategy source code
/*backtest
start: 2025-01-20 00:00:00
end: 2025-01-31 00:00:00
period: 1m
basePeriod: 1m
exchanges: [{"eid":"Binance","currency":"DOGE_USDT"}]
*/

//@version=5
strategy("Enhanced GBP/USD Strategy with ADX", overlay=true, default_qty_type=strategy.percent_of_equity, default_qty_value=1)

// === Input Parameters ===
emaFastLength = input.int(20, title="Fast EMA Length") 
emaSlowLength = input.int(50, title="Slow EMA Length") 
rsiLength = input.int(14, title="RSI Length") 
rsiOverbought = input.int(70, title="RSI Overbought") 
rsiOversold = input.int(30, title="RSI Oversold") 
atrLength = input.int(14, title="ATR Length") 
adxLength = input.int(14, title="ADX Length") 
riskToReward = input.float(2.0, title="Risk-Reward Ratio (R:R)") 
slMultiplier = input.float(1.5, title="SL Multiplier (ATR)") 

// === Indicator Calculations ===
emaFast = ta.ema(close, emaFastLength)
emaSlow = ta.ema(close, emaSlowLength)
rsi = ta.rsi(close, rsiLength)
atr = ta.atr(atrLength)

// === ADX Calculation ===
// Components of ADX
tr = ta.rma(ta.tr, adxLength)  // True Range smoothed
plusDM = ta.rma(math.max(high - high[1], 0), adxLength)  // +DM
minusDM = ta.rma(math.max(low[1] - low, 0), adxLength)   // -DM
plusDI = (plusDM / tr) * 100
minusDI = (minusDM / tr) * 100
dx = math.abs(plusDI - minusDI) / (plusDI + minusDI) * 100
adx = ta.rma(dx, adxLength)  // Final ADX value

// === Entry Conditions ===
isUptrend = emaFast > emaSlow and adx > 20
isDowntrend = emaFast < emaSlow and adx > 20

buySignal = isUptrend and ta.crossover(rsi, rsiOversold)
sellSignal = isDowntrend and ta.crossunder(rsi, rsiOverbought)

// === Stop-Loss and Take-Profit ===
slDistance = atr * slMultiplier
tpDistance = slDistance * riskToReward

buySL = buySignal ? close - slDistance : na
buyTP = buySignal ? close + tpDistance : na
sellSL = sellSignal ? close + slDistance : na
sellTP = sellSignal ? close - tpDistance : na

// === Execute Trades ===
if buySignal
    strategy.entry("Buy", strategy.long)
    strategy.exit("Buy TP/SL", from_entry="Buy", stop=buySL, limit=buyTP)

if sellSignal
    strategy.entry("Sell", strategy.short)
    strategy.exit("Sell TP/SL", from_entry="Sell", stop=sellSL, limit=sellTP)

// === Plotting ===
plot(emaFast, title="Fast EMA", color=color.blue)
plot(emaSlow, title="Slow EMA", color=color.orange)

plotshape(buySignal, title="Buy Signal", location=location.belowbar, color=color.green, style=shape.labelup, text="BUY")
plotshape(sellSignal, title="Sell Signal", location=location.abovebar, color=color.red, style=shape.labeldown, text="SELL")

plot(buySL, title="Buy Stop Loss", color=color.red, linewidth=1)
plot(buyTP, title="Buy Take Profit", color=color.green, linewidth=1)
plot(sellSL, title="Sell Stop Loss", color=color.red, linewidth=1)
plot(sellTP, title="Sell Take Profit", color=color.green, linewidth=1)

// === Alerts ===
alertcondition(buySignal, title="Buy Alert", message="Buy Signal Detected!")
alertcondition(sellSignal, title="Sell Alert", message="Sell Signal Detected!")