Multi-Technical Indicator Trend Following Channel Breakout Trading Strategy with Candlestick Pattern Filtering System

EMA ATR
Created on: 2025-02-20 16:26:40 Modified on: 2025-02-27 17:30:47
Copy: 0 Number of hits: 312
avatar of ianzeng123 ianzeng123
2
Follow
319
Followers

 Multi-Technical Indicator Trend Following Channel Breakout Trading Strategy with Candlestick Pattern Filtering System  Multi-Technical Indicator Trend Following Channel Breakout Trading Strategy with Candlestick Pattern Filtering System

Overview

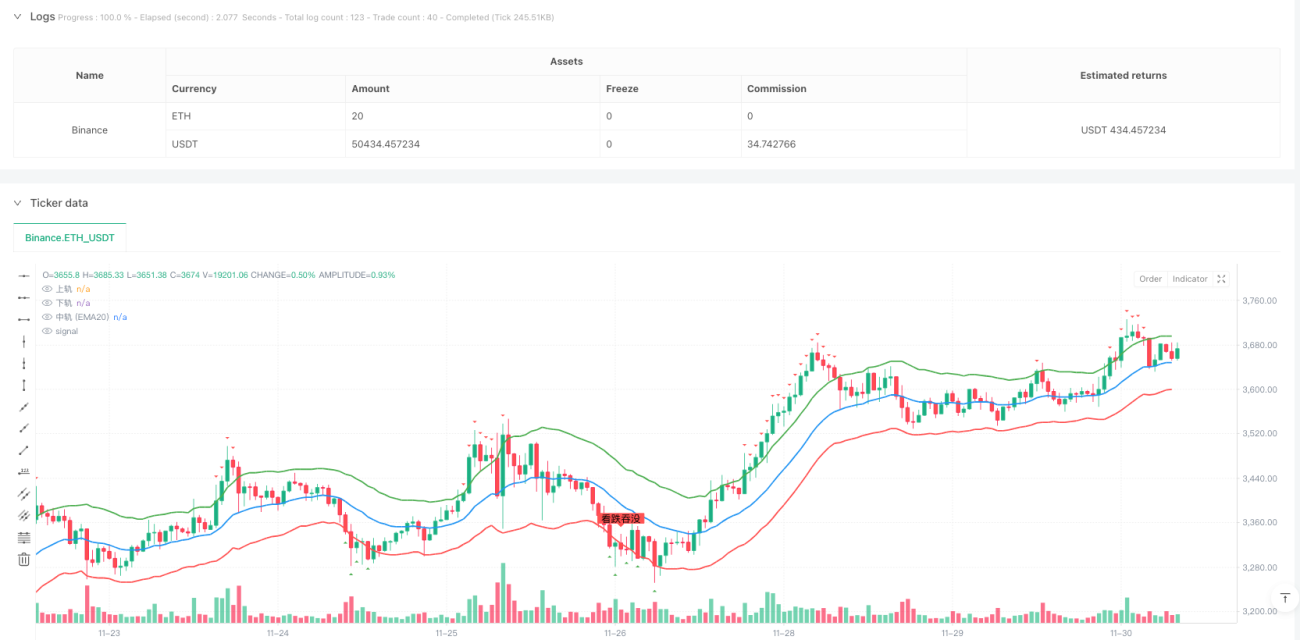
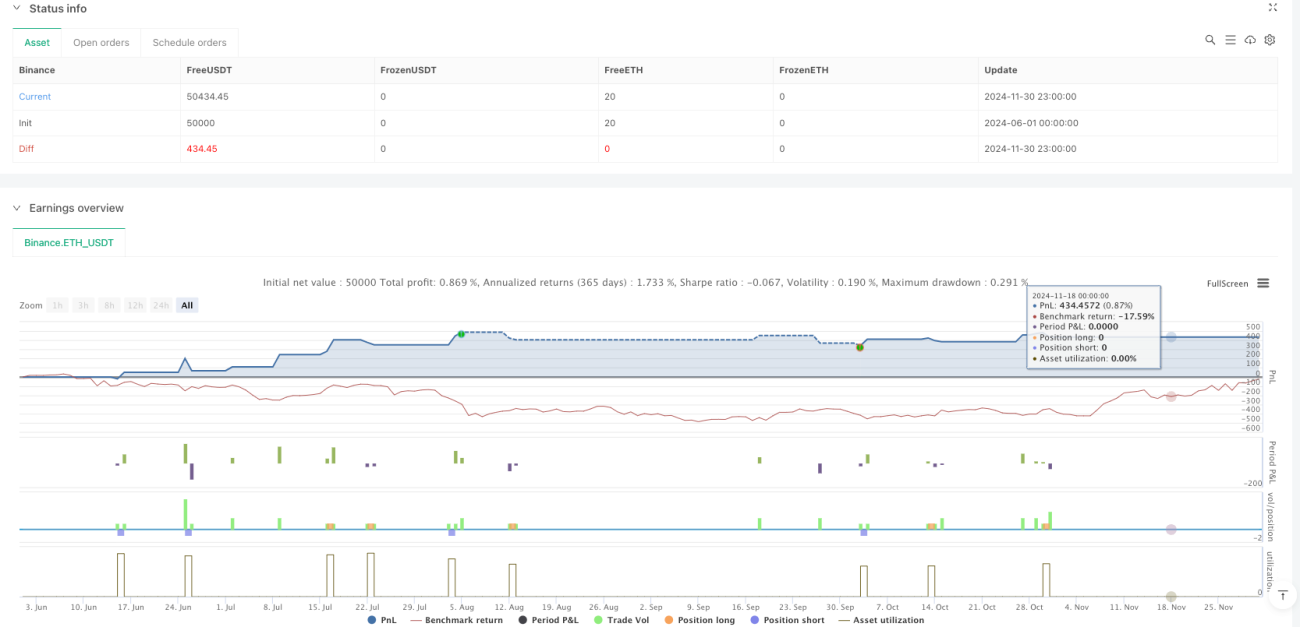
This strategy is a multi-dimensional technical indicator trading system combining Keltner Channel, candlestick patterns, and volume analysis. The strategy monitors price breakouts of the channel while using volume and candlestick patterns as filtering conditions to enhance signal reliability. The system includes a comprehensive money management mechanism with dynamic stop-loss and take-profit settings based on ATR.

Strategy Principles

The strategy is built on these core components: 1. Uses 20-period EMA as the trend middle line, combined with 1.5x ATR to construct upper and lower bands, forming the Keltner Channel 2. Identifies potential trading opportunities by monitoring closing price breakouts of channel boundaries 3. Applies volume filtering, requiring breakout volume above 20-period average 4. Incorporates bullish/bearish engulfing patterns as additional confirmation signals 5. Employs 1.5x ATR for stop-loss and 2x ATR for take-profit, achieving a risk-reward ratio of approximately 1:1.33

Strategy Advantages

  1. Multiple technical indicator cross-validation improves signal reliability
  2. Dynamic channel width adapts to market volatility changes
  3. Volume confirmation enhances trading signal validity
  4. Candlestick pattern filtering reduces false breakout interference
  5. Comprehensive stop-loss and take-profit mechanism protects capital
  6. Visualization markers help traders identify false breakouts

Strategy Risks

  1. May generate frequent false breakout signals in ranging markets
  2. Stop-loss levels might be too wide during intense volatility
  3. Multiple filtering conditions could miss some valid signals
  4. Engulfing patterns may become less reliable in certain market conditions
  5. Fixed multiplier for stop-loss and take-profit may not suit all market environments

Strategy Optimization Directions

  1. Introduce trend strength indicator (like ADX) to filter ranging markets
  2. Develop adaptive ATR multiplier adjustment mechanism
  3. Add more candlestick pattern recognition to improve signal quality
  4. Dynamically adjust stop-loss and take-profit multipliers based on market volatility
  5. Add time filtering to avoid trading during unfavorable periods
  6. Develop market state classification system for parameter adaptation

Summary

This strategy integrates multiple technical analysis tools to build a relatively complete trading system. Its strengths lie in multiple signal confirmation mechanisms and comprehensive risk management system, but still requires optimization based on specific market characteristics. Successful application requires traders to deeply understand each component’s role and maintain flexibility in actual trading.

Strategy source code
/*backtest
start: 2024-06-01 00:00:00
end: 2024-12-01 00:00:00
period: 1h
basePeriod: 1h
exchanges: [{"eid":"Binance","currency":"ETH_USDT"}]
*/

//@version=5
strategy("Keltner Channel Breakout with Candlestick Patterns (Manual) - Visualize False Breakouts with Chinese Labels", overlay=true)

// 输入参数
length = input.int(20, title="EMA 长度")
mult = input.float(1.5, title="ATR 乘数")  // 让通道稍微紧一点,增加突破机会
atrLength = input.int(14, title="ATR 长度")
volLength = input.int(20, title="成交量长度")
stopLossMultiplier = input.float(1.5, title="止损ATR倍数")
takeProfitMultiplier = input.float(2.0, title="止盈ATR倍数")

// 计算 Keltner 通道
ema20 = ta.ema(close, length)
atr = ta.atr(atrLength)
upper = ema20 + mult * atr
lower = ema20 - mult * atr

// 绘制 Keltner 通道
plot(upper, color=color.green, linewidth=2, title="上轨")
plot(lower, color=color.red, linewidth=2, title="下轨")
plot(ema20, color=color.blue, linewidth=2, title="中轨 (EMA20)")

// 判断突破
breakout_up = close > upper
breakout_down = close < lower

// 成交量过滤:当前成交量是否高于过去 N 根 K 线的平均成交量
volume_above_avg = volume > ta.sma(volume, volLength)

// 手动判断 K线形态:看涨吞没和看跌吞没
bullish_engulfing = close > open and open[1] > close[1] and close > open[1] and open < close[1]
bearish_engulfing = close < open and open[1] < close[1] and close < open[1] and open > close[1]

// 只在突破上轨和下轨时应用 K线形态过滤
valid_breakout_up = breakout_up and volume_above_avg and bullish_engulfing
valid_breakout_down = breakout_down and volume_above_avg and bearish_engulfing

// 交易信号
long_condition = valid_breakout_up
short_condition = valid_breakout_down

// 交易策略
if (long_condition)
    strategy.entry("Long", strategy.long, comment="做多")

if (short_condition)
    strategy.entry("Short", strategy.short, comment="做空")

// 止损 & 止盈
long_stop_loss = close - stopLossMultiplier * atr
long_take_profit = close + takeProfitMultiplier * atr
short_stop_loss = close + stopLossMultiplier * atr
short_take_profit = close - takeProfitMultiplier * atr

strategy.exit("Exit Long", from_entry="Long", stop=long_stop_loss, limit=long_take_profit)
strategy.exit("Exit Short", from_entry="Short", stop=short_stop_loss, limit=short_take_profit)

// 可视化假突破事件
plotshape(series=breakout_up and not bullish_engulfing, location=location.abovebar, color=color.red, style=shape.triangledown, title="假突破-上")
plotshape(series=breakout_down and not bearish_engulfing, location=location.belowbar, color=color.green, style=shape.triangleup, title="假突破-下")

// 可视化 K线形态(中文标签)
plotshape(series=bullish_engulfing and breakout_up, location=location.belowbar, color=color.green, style=shape.labelup, title="看涨吞没", text="看涨吞没")
plotshape(series=bearish_engulfing and breakout_down, location=location.abovebar, color=color.red, style=shape.labeldown, title="看跌吞没", text="看跌吞没")