Multi-Indicator Synergistic Trend Reversal Trading Strategy: RSI Overbought/Oversold Signals Combined with SAR and Moving Average Dynamic Risk Control System

Overview
This strategy is a multi-indicator synergistic trend reversal trading system that combines the Relative Strength Index (RSI), Parabolic SAR, and Simple Moving Average (SMA). The core concept is to use RSI overbought/oversold signals to alert potential reversal opportunities, confirm reversal signals through SAR direction changes, and utilize moving averages as dynamic profit-taking and stop-loss references. This multi-indicator synergistic verification method effectively reduces false signals and improves trading reliability.
Strategy Principle
The strategy operates in three main steps:
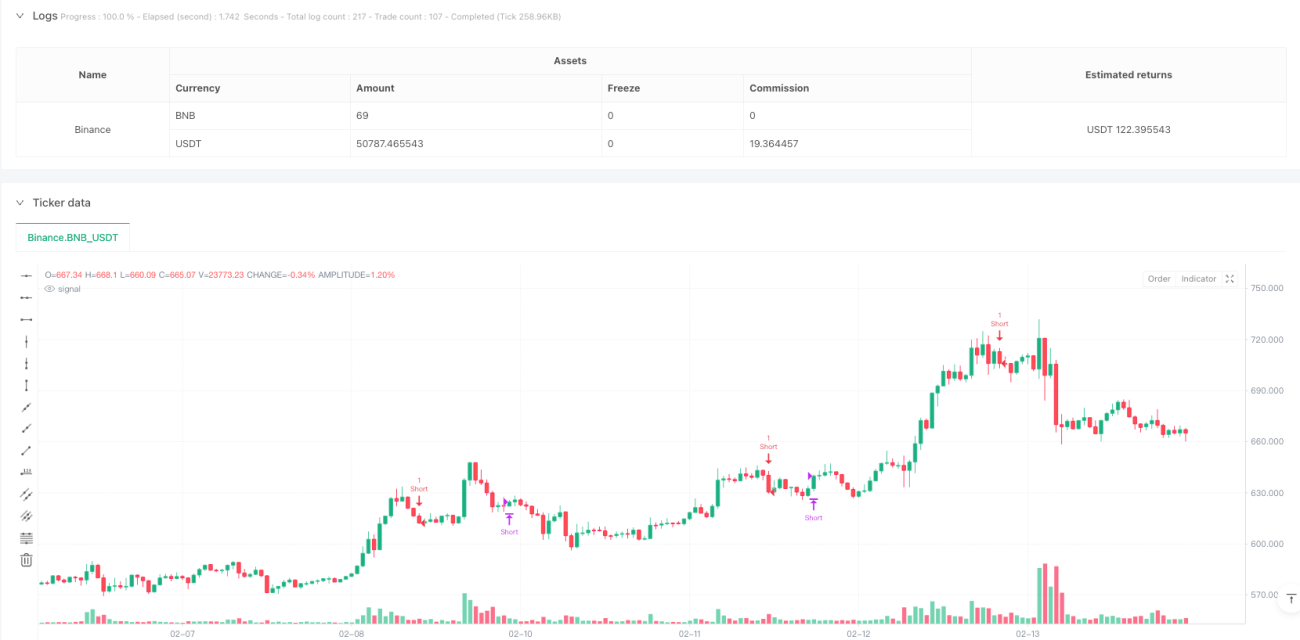
- Signal Alert: Monitor RSI for overbought (>70) or oversold (<30) signals, which often indicate potential price reversals.
- Entry Confirmation: Within 1-3 candles after an RSI signal, if the SAR indicator also shows a direction reversal (from above to below or vice versa), entry signal is confirmed. Specifically:
- Long Entry: SAR moves below price within 3 candles of RSI oversold
- Short Entry: SAR moves above price within 3 candles of RSI overbought
- Exit Mechanism: Use 21-period SMA as dynamic stop-loss line, close positions when price crosses the average:
- Long Exit: Price breaks below 21 SMA
- Short Exit: Price breaks above 21 SMA
Strategy Advantages
- Multiple Verification: Synergistic confirmation through RSI and SAR effectively filters false signals and improves trading accuracy.
- Dynamic Risk Control: Using moving averages as dynamic stop-loss reference allows profitable trends to develop while effectively controlling losses.
- Adjustable Parameters: All parameters (RSI period, overbought/oversold thresholds, SAR parameters) can be optimized for different market characteristics.
- Clear Logic: Clear entry and exit conditions facilitate backtesting and live trading.
Strategy Risks
- Consolidation Risk: During sideways markets, RSI and SAR may generate frequent reversal signals, leading to overtrading.
- Slippage Impact: Using moving averages as stop-loss points may face significant slippage during volatile markets.
- Parameter Sensitivity: Strategy performance is sensitive to parameter settings, different market environments may require different parameter combinations.
- False Breakout Risk: Price breakouts above/below moving averages may be false, causing unnecessary stops.
Strategy Optimization Directions
- Market Environment Recognition: Add trend strength indicators (like ADX) to reduce trading frequency or pause trading during consolidation.
- Stop-Loss Optimization: Add buffer to moving average or dynamically adjust stop-loss distance using ATR.
- Position Management: Dynamically adjust position size based on signal strength and market volatility.
- Time Filtering: Add trading time window restrictions to avoid low liquidity periods.
- Signal Strength Classification: Set different trading weights based on different RSI and SAR signal combinations.
Summary
This strategy builds a relatively reliable trend reversal trading system through RSI and SAR coordination. Using moving averages as dynamic risk control tools ensures effective trend capture while achieving dynamic risk control. The main advantages lie in multiple signal verification and clear trading rules, but practical application requires attention to market environment recognition and dynamic parameter optimization. Strategy stability and profitability can be further improved through market environment filtering, stop-loss optimization, position management enhancement, and other improvements.
- 1