
Overview
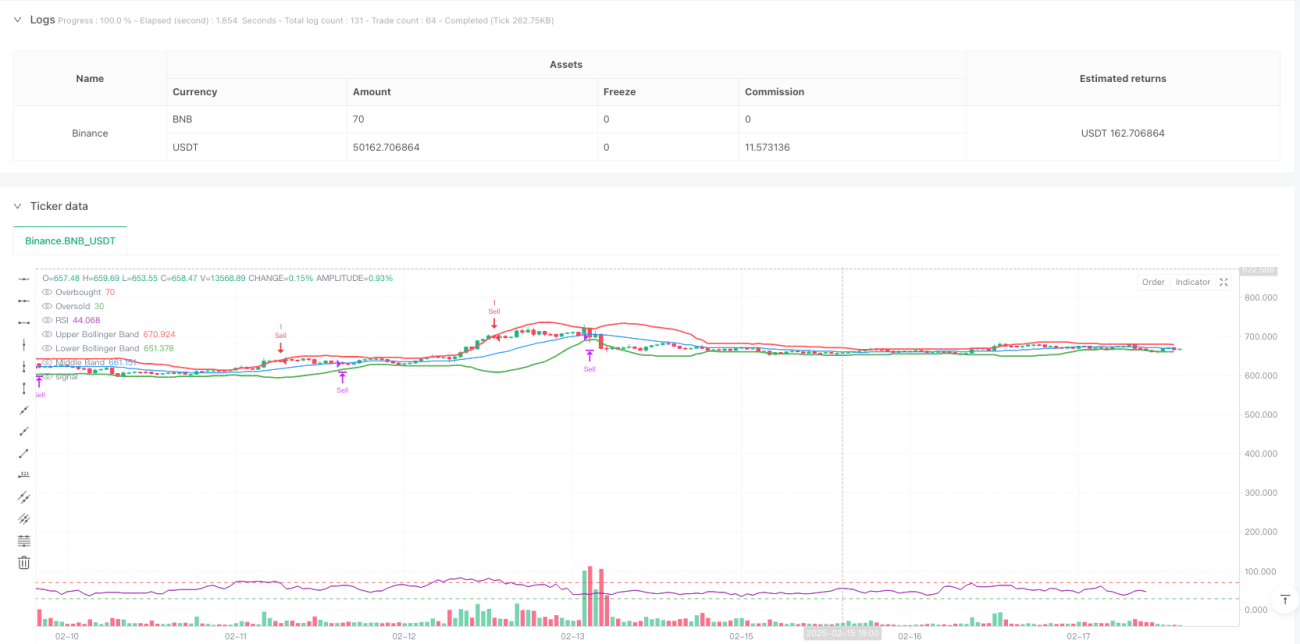
This strategy is a technical analysis trading system that combines Bollinger Bands and Relative Strength Index (RSI). It seeks trading opportunities in overbought and oversold areas by utilizing price volatility and market momentum characteristics. The strategy generates buy signals when RSI indicates oversold conditions (below 30) and price breaks above the lower Bollinger Band; sell signals are generated when RSI indicates overbought conditions (above 70) and price breaks below the upper Bollinger Band. The middle Bollinger Band is used as a stop-loss position.
Strategy Principles
The core logic of the strategy is based on the following key elements:
- Bollinger Bands parameters use 20-period moving average as the middle band, with a standard deviation multiplier of 2.0
- RSI uses the traditional 14-period setting
- Entry conditions:
- Buy: price breaks above lower Bollinger Band and RSI<30
- Sell: price breaks below upper Bollinger Band and RSI>70
- Exit conditions: positions are closed when price crosses the middle Bollinger Band (20-period moving average)
This combination considers both price statistics and momentum indicators, effectively improving trading accuracy.
Strategy Advantages
- Multiple confirmation mechanism: combines price and momentum indicators to reduce false signals
- Reasonable risk control: uses middle Bollinger Band as stop-loss point for both profit protection and risk control
- Strong adaptability: Bollinger Bands automatically adjust bandwidth based on market volatility
- Classic parameter settings: uses widely validated parameter combinations for strategy stability
- Clear logic: trading rules are explicit, facilitating backtesting and live trading
Strategy Risks
- Choppy market risk: may generate frequent trading signals in sideways markets
- Trend market risk: might miss part of strong trends
- Parameter sensitivity: strategy performance is significantly affected by Bollinger Bands period and RSI settings
- Slippage impact: may face significant slippage during rapid price movements
Recommended risk management measures:
- Set appropriate position sizing
- Add trend filters
- Optimize parameter adaptation mechanism
- Consider trading costs in backtesting
Strategy Optimization Directions
- Dynamic parameter optimization:
- Dynamically adjust Bollinger Bands parameters based on market volatility
- Adjust RSI thresholds based on market conditions
- Add auxiliary indicators:
- Include volume confirmation
- Consider trend indicators as filters
- Improve stop-loss mechanism:
- Implement trailing stops
- Set maximum loss limits
- Optimize trade execution:
- Implement partial position trading
- Add entry price optimization logic
Conclusion
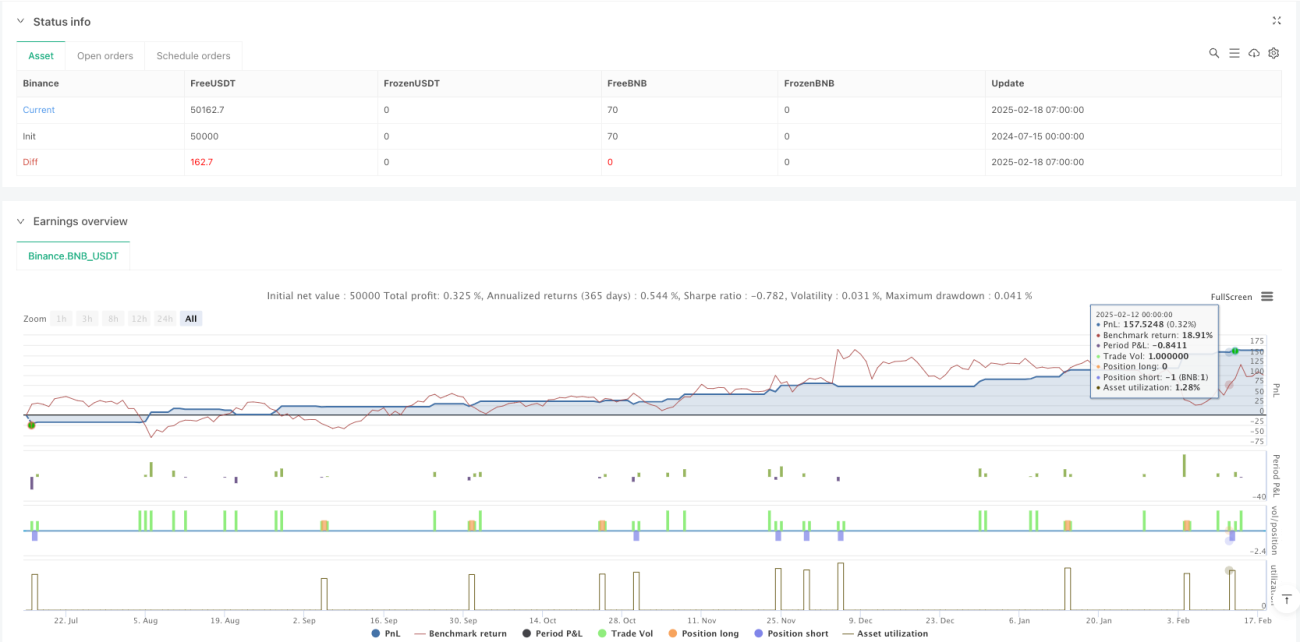
This strategy constructs a relatively complete trading system by combining Bollinger Bands and RSI indicators. The strategy logic is clear, risk control is reasonable, and it has practical value. Through the suggested optimization directions, there is room for further improvement. In practical application, investors are advised to make appropriate adjustments based on their risk tolerance and market conditions.
- 1