
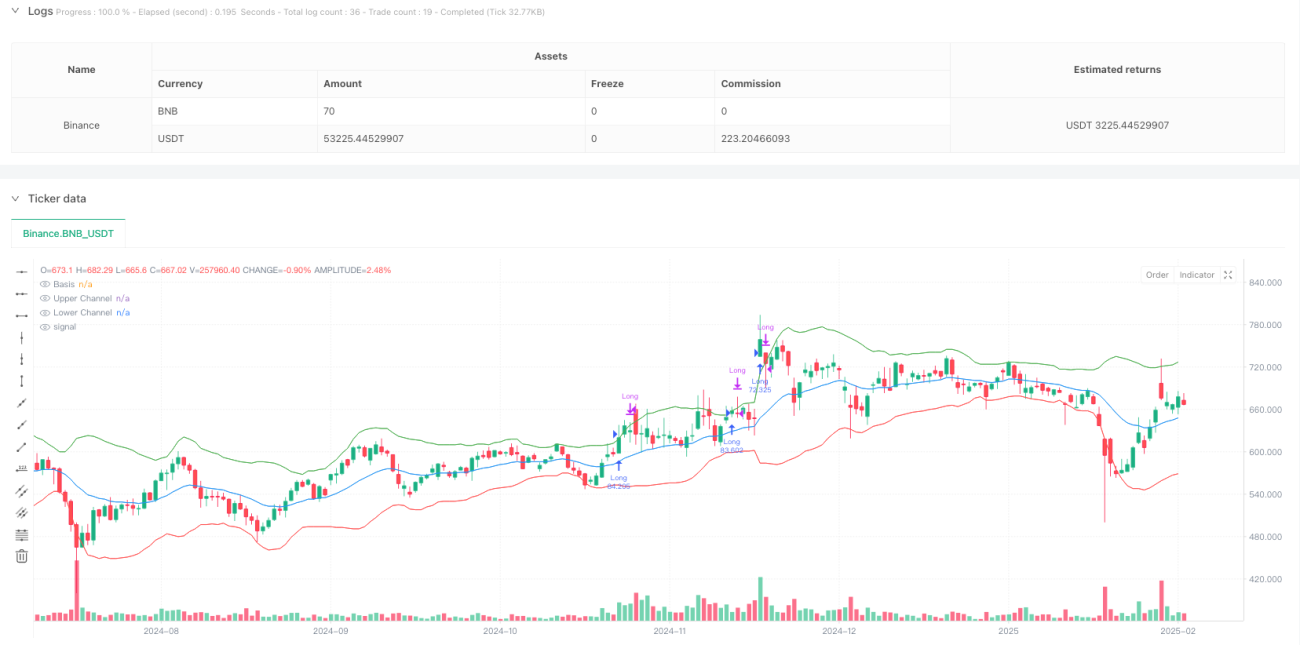
Overview
This strategy is a quantitative trading system that combines the Gaussian Channel and Stochastic RSI indicators. It captures market trend reversal opportunities by monitoring price crossovers with the Gaussian Channel and Stochastic RSI movements. The Gaussian Channel, constructed using moving averages and standard deviations, dynamically reflects market volatility ranges, while the Stochastic RSI provides momentum confirmation signals.
Strategy Principles
The core logic of the strategy includes the following key components:
- Gaussian Channel Construction: Uses a 20-period EMA as the channel centerline, with upper and lower boundaries calculated by adding and subtracting 2 times the standard deviation.
- Stochastic RSI Calculation: First calculates 14-period RSI, then applies a 14-period stochastic formula to the RSI values, finally smoothing the results with a 3-period average to get K and D lines.
- Trade Signal Generation: Generates long signals when price breaks above the upper Gaussian Channel and Stochastic RSI's K line crosses above the D line; exits when price falls below the upper channel.
Strategy Advantages
- High Signal Reliability: Combines trend and momentum indicators to effectively reduce false signals.
- Comprehensive Risk Control: Uses the dynamic nature of the Gaussian Channel to automatically adjust trading ranges based on market volatility.
- Strong Adaptability: Through parameterized design, the strategy can adapt to different market environments and trading instruments.
- High Execution Efficiency: Clear and simple strategy logic with low computational requirements, suitable for real-time trading.
Strategy Risks
- Lag Risk: Moving averages and standard deviation calculations have inherent lag, potentially causing delayed entry timing.
- False Breakout Risk: Frequent false breakout signals may occur in ranging markets.
- Parameter Sensitivity: Strategy performance is sensitive to parameter settings, which may need adjustment in different market environments.
- Market Environment Dependency: Strategy may underperform in sideways markets with unclear trends.
Strategy Optimization Directions
- Signal Filtering Optimization: Add volume, volatility, and other auxiliary indicators to filter trading signals.
- Dynamic Parameter Adjustment: Introduce adaptive mechanisms to dynamically adjust channel and Stochastic RSI parameters based on market conditions.
- Stop Loss Enhancement: Add trailing stops or volatility-based dynamic stop loss mechanisms.
- Position Management Optimization: Dynamically adjust position sizes based on signal strength and market volatility.
Summary
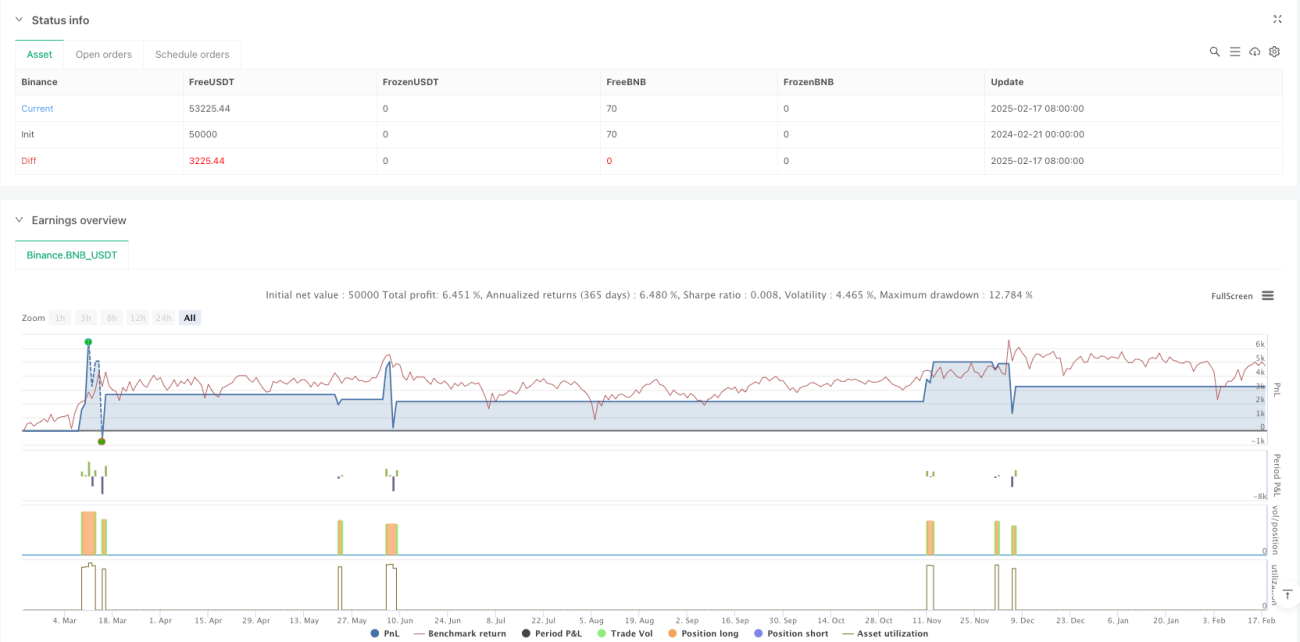
This strategy constructs a logically complete and risk-controlled quantitative trading system by combining trend following and momentum indicators from technical analysis. While there are some inherent risks, through continuous optimization and improvement, the strategy shows promise for maintaining stable performance across different market environments. The modular design also provides a solid foundation for future optimization and expansion.
/*backtest
start: 2024-02-21 00:00:00
end: 2025-02-18 08:00:00
period: 1d
basePeriod: 1d
exchanges: [{"eid":"Binance","currency":"BNB_USDT"}]
*/

//@version=5
strategy("SAJJAD JAMSHIDI Channel with Stochastic RSI Strategy", overlay=true, commission_type=strategy.commission.percent, commission_value=0.1, slippage=0, default_qty_type=strategy.percent_of_equity, default_qty_value=100, process_orders_on_close=true)

// Gaussian Channel Inputs- 1