Multi-Indicator Crossover Trend Following Strategy with Fibonacci Retracement and Stop-Loss/Take-Profit Optimization System

Overview
This strategy is a comprehensive trading system that combines Exponential Moving Average (EMA) crossover, Fibonacci retracement levels, trend determination, and stop-loss/take-profit mechanisms. The strategy generates trading signals based on the crossover of 9-period and 21-period EMAs, optimizes entry points using Fibonacci retracement levels, and enhances accuracy through real-time trend monitoring. The system also incorporates percentage-based stop-loss and take-profit mechanisms for effective risk control.
Strategy Principles
The core logic of the strategy is based on the following key elements:
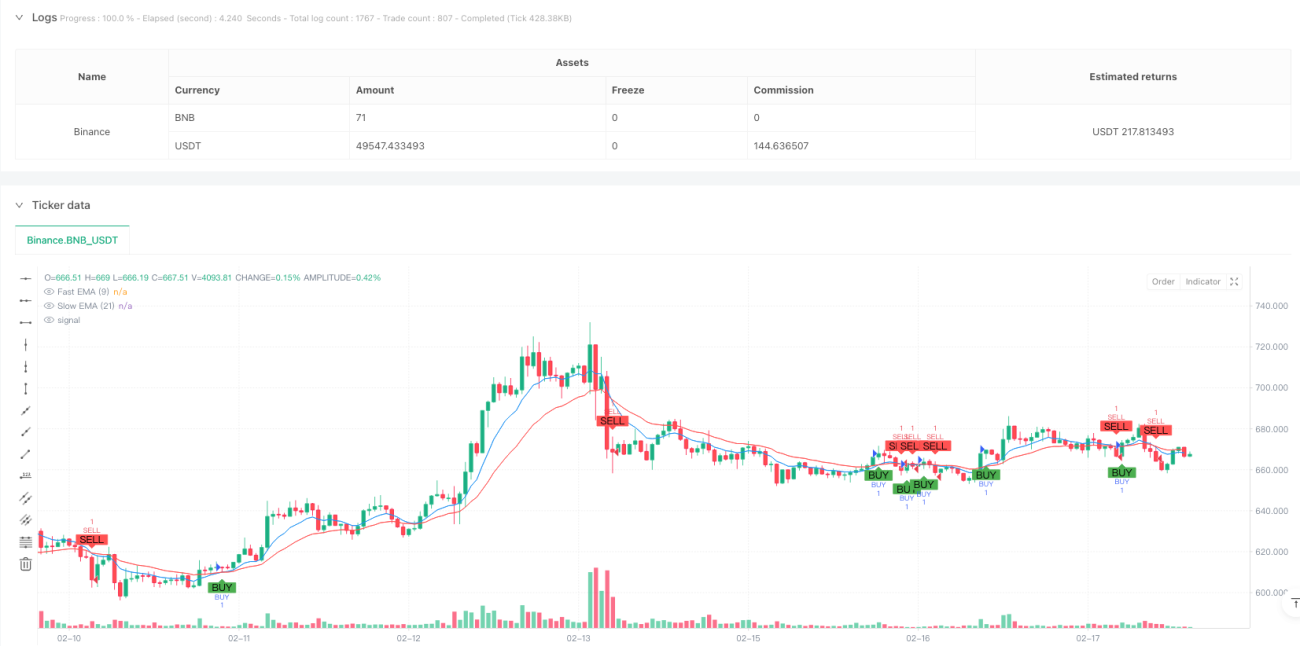
- A long signal is generated when the fast EMA (9-period) crosses above the slow EMA (21-period)
- A short signal is generated when the fast EMA crosses below the slow EMA
- Fibonacci retracement levels at 23.6%, 38.2%, 50%, and 61.8% are calculated using the highest and lowest prices over 100 periods
- Current trend status is determined by the relationship between closing price and fast EMA
- The system automatically sets fixed percentage-based take-profit (4%) and stop-loss (2%) levels upon trade execution
Strategy Advantages
- Multi-dimensional signal confirmation: Combines EMA crossover, Fibonacci levels, and trend status for more reliable trading signals
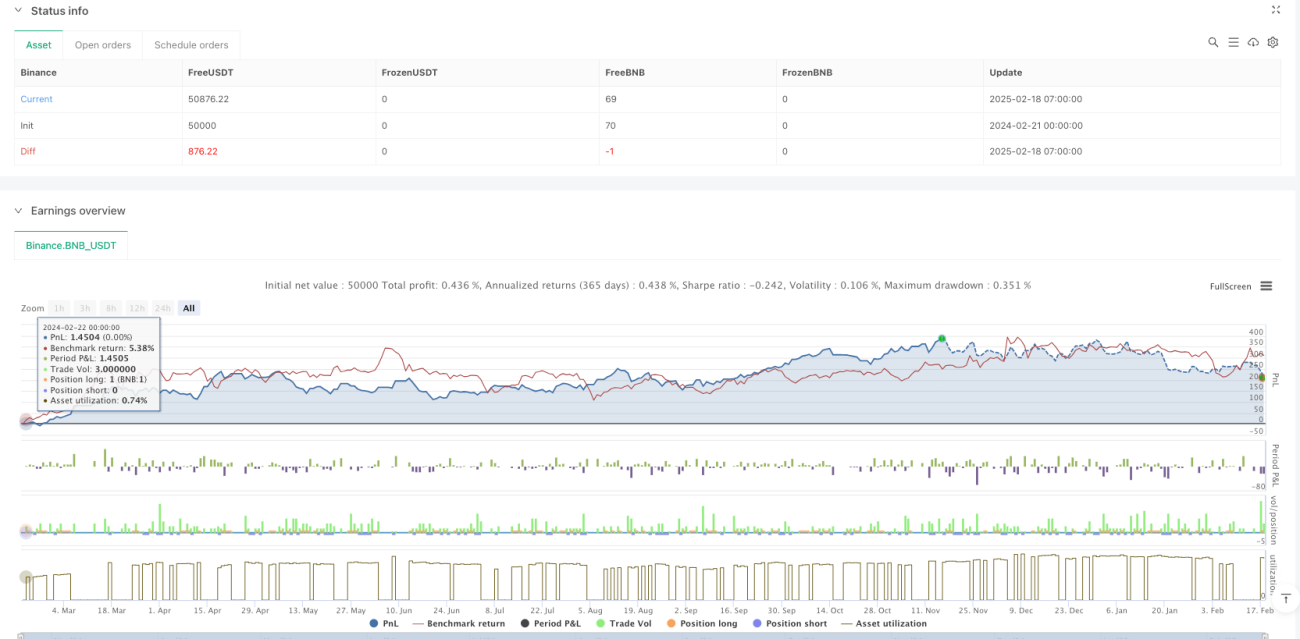
- Comprehensive risk management: Achieves automated risk control through preset stop-loss and take-profit percentages
- Strong trend-following capability: EMA crossover combined with trend status effectively captures market trends
- Clear visual feedback: Displays key price levels, trend status, and trading signals through labels for better decision-making
- High systematization: Clear trading logic reduces interference from subjective judgments
Strategy Risks
- Oscillation market risk: Frequent EMA crossovers during consolidation phases may generate false signals
- Lag risk: Moving averages are inherently lagging indicators, potentially missing optimal entry points
- Fixed stop-loss risk: Preset fixed percentage stops may not suit all market conditions
- Signal conflict risk: Multiple indicators may generate contradictory signals, complicating decision-making
- Market volatility risk: Extreme volatility may lead to inappropriate stop-loss levels
Strategy Optimization Directions
- Dynamic stop-loss optimization: Adjust stop-loss distances based on ATR or market volatility
- Enhanced signal filtering: Add volume, momentum, and other auxiliary indicators to filter false signals
- Parameter adaptation: Introduce adaptive mechanisms to dynamically adjust EMA periods based on market conditions
- Entry optimization: Optimize entries near Fibonacci levels by incorporating price patterns and volume
- Position management improvement: Design dynamic position sizing system based on volatility and account risk
Summary
This strategy builds a relatively complete trading system by integrating multiple classic technical analysis tools. Its strengths lie in multi-dimensional signal confirmation and systematic risk management, though optimization for different market environments is still necessary. Traders are advised to optimize parameters according to specific market conditions when implementing the strategy in live trading, while maintaining vigilance toward risks.
- 1