
Overview
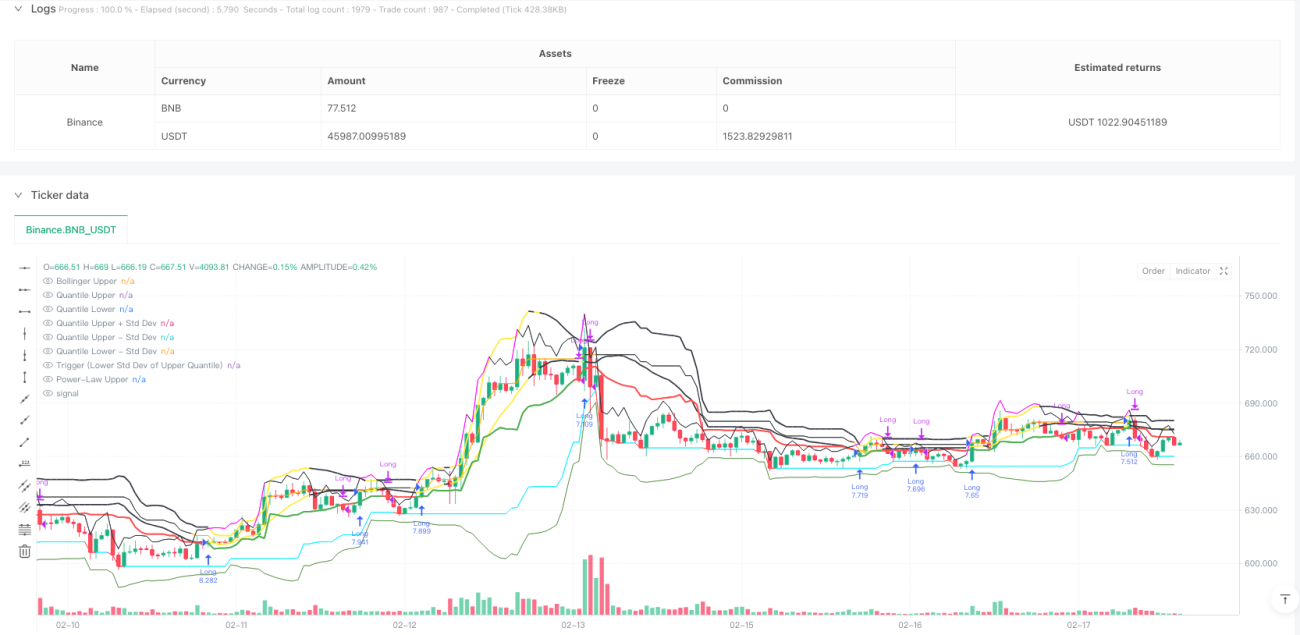
This is a trading strategy based on multiple statistical bands and trend analysis. The strategy combines Bollinger Bands, Quantile Bands, and Power-Law Bands to identify key support/resistance zones, using the lower standard deviation line of the upper quantile band as a trigger signal for entry and exit timing. The strategy design fully considers market volatility and improves signal reliability through the overlay of multiple statistical methods.
Strategy Principles
The core principle of the strategy is to capture market trends through the intersection of multiple statistical bands. It includes the following key components:
- Bollinger Band System - Used to judge price volatility range, turning yellow when price breaks above the upper band.
- Quantile Band System - Calculates upper and lower quantiles of price to evaluate probability extremes.
- Power-Law Band System - Calculates significance levels based on historical returns to measure overbought/oversold conditions.
- Trigger System - Uses the lower standard deviation line of the upper quantile band as the main trigger signal, with price maintenance above this line viewed as a bullish signal.
- Confirmation System - Filters false signals by setting consecutive confirmation bar requirements.
Strategy Advantages
- Strong Signal Stability - Multiple statistical bands overlay effectively reduces false signals.
- Good Adaptability - Strategy can adapt to different timeframes and market conditions.
- Complete Risk Control - Uses multiple statistical bands to define risk zones with stop-loss mechanisms.
- Flexible Parameters - Provides rich parameter options for optimization based on different market characteristics.
- Clear Visualization - Various indicator lines are clearly color-differentiated with intuitive trading signals.
Strategy Risks
- Lag Risk - Statistical indicators have inherent lag, potentially missing optimal entry points.
- Unfavorable in Choppy Markets - May generate excessive trading signals in sideways markets.
- Parameter Sensitivity - Different parameter combinations show large performance variations, requiring repeated optimization.
- High Computation Load - Real-time calculation of multiple statistical indicators requires significant computational resources.
- Market Environment Dependency - Statistical patterns may fail in extreme market conditions.
Strategy Optimization Directions
- Introduce Dynamic Parameters - Automatically adjust parameters based on market volatility.
- Add Market Environment Assessment - Include trend strength indicators to filter signals in choppy markets.
- Optimize Calculation Efficiency - Simplify certain calculation processes to reduce resource usage.
- Improve Risk Control - Add more stop-loss conditions and position management strategies.
- Enhance Adaptability - Develop adaptive parameter optimization systems.
Summary
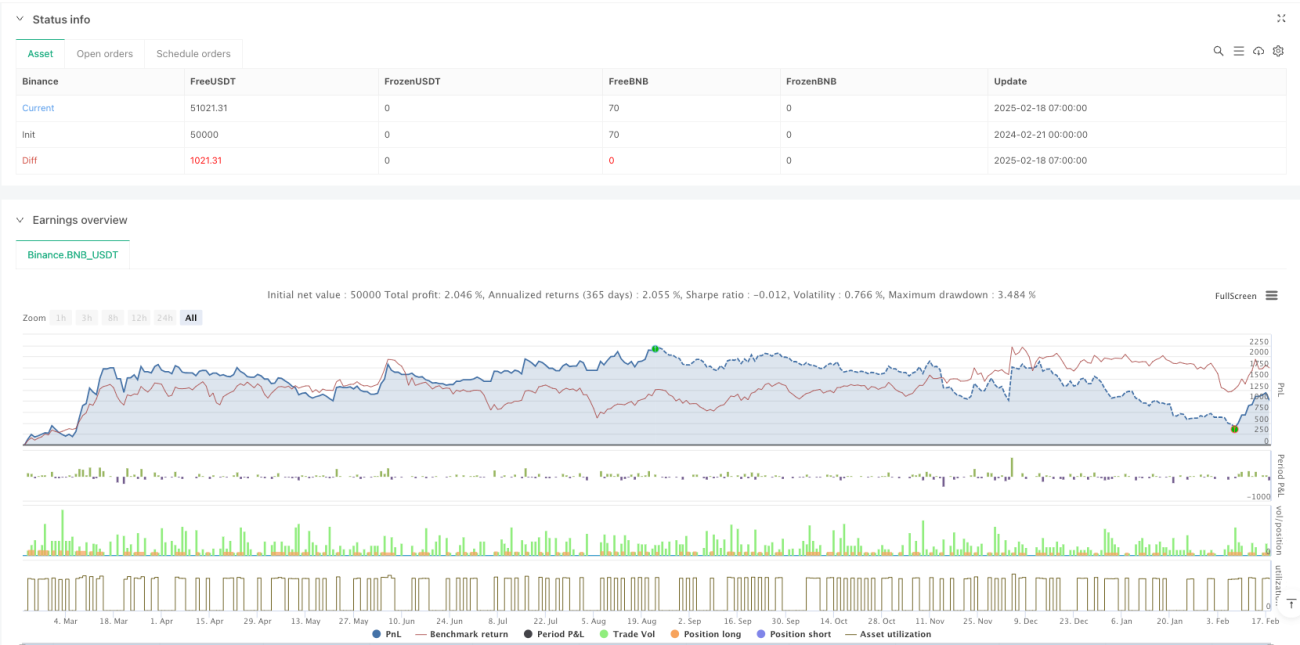
This is a comprehensive trend-following strategy that integrates multiple statistical methods. Through the synergy of Bollinger Bands, Quantile Bands, and Power-Law Bands, it can effectively capture market trends while maintaining good risk control capabilities. Although it has certain lag issues and parameter optimization challenges, through continuous improvement and optimization, this strategy has good practical value and development prospects.
/*backtest
start: 2024-02-21 00:00:00
end: 2025-02-18 08:00:00
period: 1h
basePeriod: 1h
exchanges: [{"eid":"Binance","currency":"BNB_USDT"}]
*/

//@version=6
strategy("Multi-Band Comparison Strategy with Separate Entry/Exit Confirmation", overlay=true,
         default_qty_type=strategy.percent_of_equity, default_qty_value=10,
initial_capital=5000, currency=currency.USD)- 1