Dynamic Stop-Loss Trend Following Strategy with RSI and MACD Dual Filtering

Overview
This strategy is a trend following system based on dual filtering with MACD and RSI indicators, integrated with a dynamic stop-loss mechanism. The strategy primarily generates trading opportunities through MACD crossover signals, uses RSI as secondary confirmation, and incorporates percentage-based stop-losses for risk control. The core strength lies in combining technical indicators to enhance signal reliability while protecting profits through dynamic stop-losses.
Strategy Principles
The strategy employs MACD(12,26,9) and RSI(14) as primary indicators. Entry signals require two conditions to be met simultaneously: MACD golden cross with RSI in oversold territory (default below 40) for long positions, and MACD death cross with RSI in overbought territory (default above 59) for short positions. The system includes a 3% dynamic stop-loss, automatically closing positions when price moves adversely beyond the set percentage. Additionally, the strategy incorporates a time filter allowing users to set specific trading time ranges.
Strategy Advantages
- Dual indicator filtering enhances trade signal reliability and reduces false signals.
- Dynamic stop-loss mechanism effectively controls risk for each trade.
- Strategy parameters can be flexibly adjusted for different market conditions.
- Time filtering functionality allows execution within specific time periods.
- Percentage-based position sizing supports effective money management.
Strategy Risks
- May generate frequent trading signals in ranging markets, increasing transaction costs.
- Fixed percentage stop-loss might trigger premature exits in highly volatile markets.
- MACD as a lagging indicator may miss significant price movements in fast markets.
- RSI threshold settings require optimization for different markets.
- Trading costs and slippage can impact actual strategy performance.
Optimization Directions
- Introduce volatility indicators to dynamically adjust stop-loss percentages.
- Add trend strength filters to avoid overtrading in ranging markets.
- Consider implementing trailing stops to protect profits.
- Optimize RSI and MACD parameters to better adapt to different market cycles.
- Include volume analysis to enhance signal reliability.
Summary
This is a well-structured trend following strategy with clear logic. The combination of MACD and RSI effectively improves trade signal quality. The dynamic stop-loss design helps control risk, providing good risk management characteristics. The strategy is suitable for markets with clear trends but requires parameter adjustment based on specific market characteristics. Through the suggested optimization directions, the strategy's stability and reliability can be further enhanced.
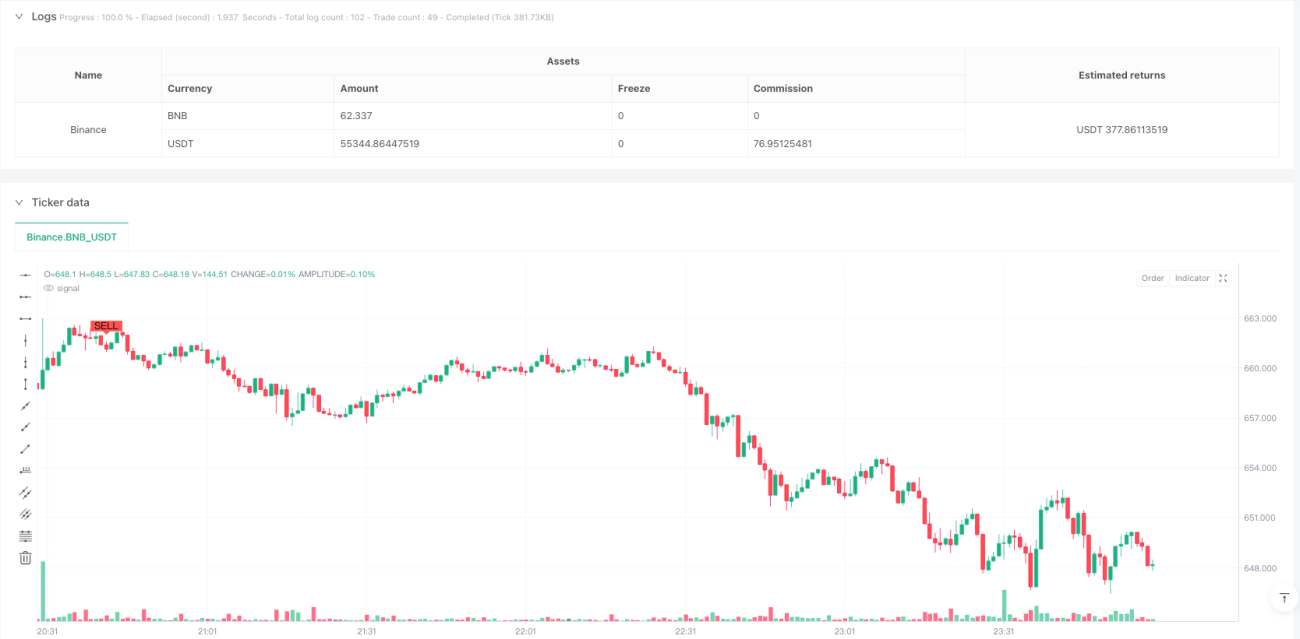
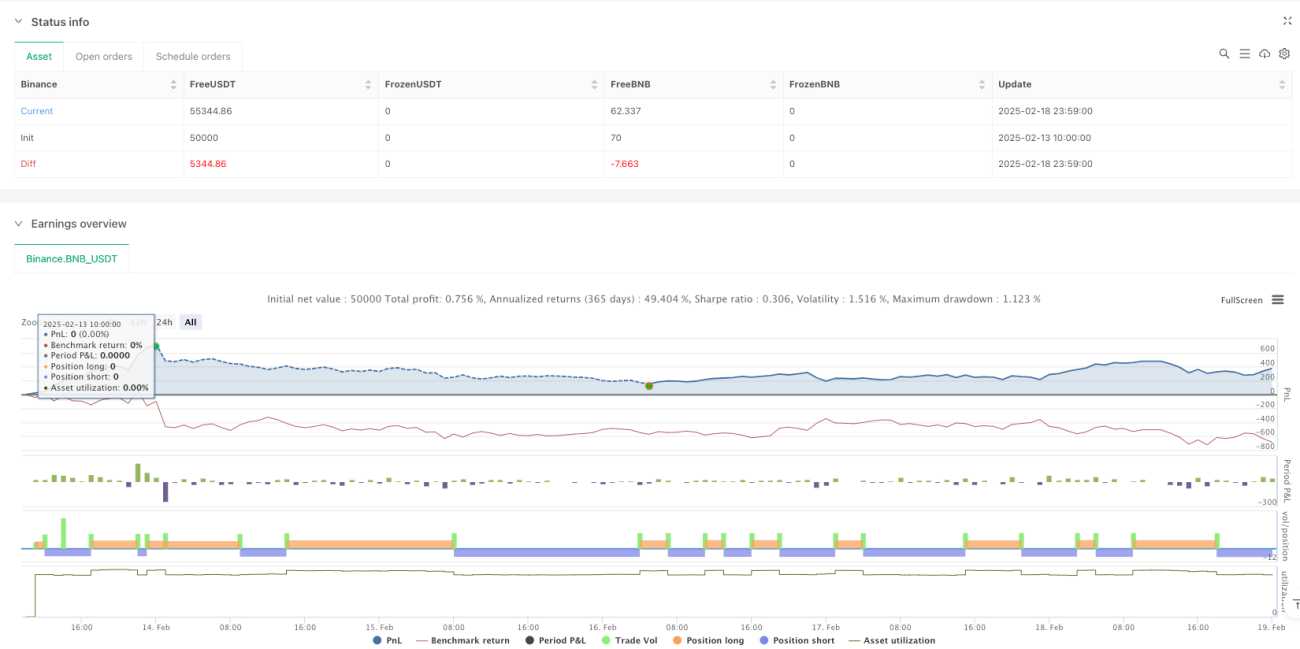
/*backtest
start: 2025-02-13 10:00:00
end: 2025-02-19 00:00:00
period: 1m
basePeriod: 1m
exchanges: [{"eid":"Binance","currency":"BNB_USDT"}]
*/

// This Pine Script™ code is subject to the terms of the Mozilla Public License 2.0 at https://mozilla.org/MPL/2.0/
// © eagle916
//@version=5
strategy("EAG MACD + RSI Strategy",overlay=true, initial_capital = 300, default_qty_value = 10, default_qty_type = "percent_of_equity", commission_type=strategy.commission.percent, commission_value=0.1)- 1