
Overview
This strategy is a trend-following trading system based on multiple technical indicators, integrating Moving Average (MA), Relative Strength Index (RSI), Bollinger Bands (BB), Moving Average Convergence Divergence (MACD), and Stochastic oscillator. It identifies market trends and trading opportunities through cross-confirmation between indicators. The strategy employs percentage-based position management, using 1% of funds for each trade by default.
Strategy Principle
The strategy determines trading signals through the following dimensions:
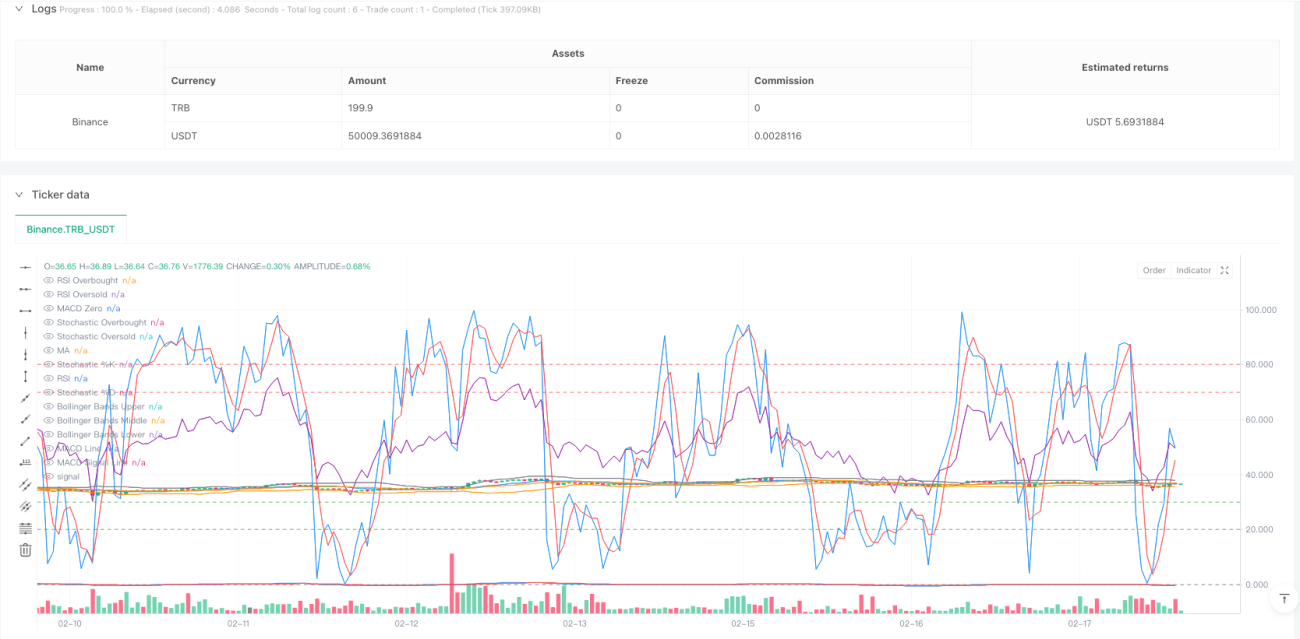
- Uses 14-period Simple Moving Average (SMA) as trend indicator baseline
- RSI indicator for overbought/oversold conditions, with 30 and 70 as key thresholds
- Bollinger Bands for price volatility range, with 20-period
- MACD indicator (12,26,9) for trend confirmation
- Stochastic oscillator (14,3) for momentum judgment
Long conditions must simultaneously satisfy:
- RSI below 30 (oversold)
- MACD line crosses above signal line
- Stochastic K value below 20
- Closing price above Bollinger Band middle line
- Previous closing price below Bollinger Band lower line
Short conditions must simultaneously satisfy:
- RSI above 70 (overbought)
- MACD line crosses below signal line
- Stochastic K value above 80
- Closing price below Bollinger Band middle line
- Previous closing price above Bollinger Band upper line
Strategy Advantages
- Multiple technical indicator cross-confirmation effectively filters false signals
- Combines trend-following and oscillating indicators, suitable for both trending and reversal markets
- Percentage-based position management effectively controls risk
- Adjustable indicator parameters provide good adaptability
- Clear trading signals, easy to execute and backtest
Strategy Risks
- Multiple indicators may lead to signal lag, affecting entry timing
- Frequent trading in oscillating markets increases costs
- Fixed parameters perform differently in various market environments
- Technical indicators may contradict each other, causing signal confusion
Suggested risk mitigation measures:
- Dynamically adjust parameters based on different market characteristics
- Set stop-loss and take-profit levels to control risk
- Combine with other indicators like volume for signal confirmation
- Regularly evaluate strategy performance and adjust timely
Strategy Optimization Directions
- Introduce adaptive parameter mechanism to dynamically adjust indicator parameters based on market volatility
- Add volume indicators as auxiliary confirmation
- Optimize position management, consider gradual position building and reduction
- Add market environment recognition module to adopt different strategies in different market conditions
- Introduce machine learning algorithms to optimize signal generation logic
Summary
This strategy establishes a relatively complete trend-following trading system through the comprehensive use of multiple technical indicators. The strategy features reliable signals and controllable risk, but still needs continuous parameter and logic optimization in live trading based on market conditions. Through continuous improvement and refinement, this strategy has the potential to achieve stable returns in different market environments.
- 1