Dynamic Breakout Trading Strategy with Multi-Period Volatility-Based Price Breakthrough Model

BREAKOUT ATR SL TP VOL momentum RSI
Created on: 2025-02-20 17:02:22 Modified on: 2025-02-27 17:27:27
Copy: 1 Number of hits: 421
avatar of ianzeng123 ianzeng123
2
Follow
319
Followers

 Dynamic Breakout Trading Strategy with Multi-Period Volatility-Based Price Breakthrough Model  Dynamic Breakout Trading Strategy with Multi-Period Volatility-Based Price Breakthrough Model

Overview

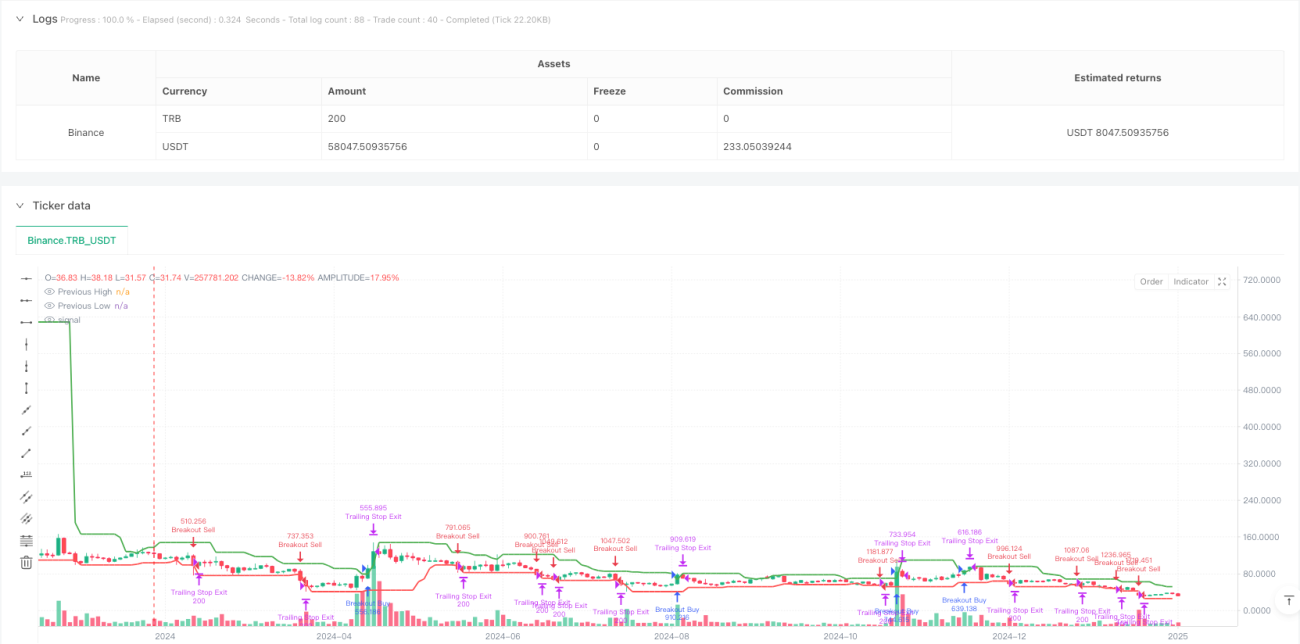
This strategy is a trading system based on price breakouts and dynamic trailing stops. It monitors the highest and lowest prices over the past N periods and executes trades when prices break through these key levels. The strategy employs an intelligent stop-loss mechanism that only activates trailing stops after achieving 1% profit, allowing profits to develop fully. It also implements a 1-hour cooldown period to avoid overtrading and improve the quality of each trade.

Strategy Principles

The core logic includes several key components: 1. Entry Signals: Calculates the highest and lowest prices over the past N periods, triggering trading signals when current prices break these levels. Long entries require prices to break above previous highs by a certain percentage, while shorts need breaks below previous lows. 2. Trade Management: Implements a 1-hour trading cooldown period to avoid frequent trading during high volatility. 3. Risk Control: Uses dynamic trailing stops that activate only after 1% profit, better protecting gains. 4. Parameter Optimization: Key parameters like lookback period, breakout threshold, and stop-loss percentage can be adjusted for different market conditions.

Strategy Advantages

  1. Dynamic Risk Management: Through trailing stop mechanism, the strategy can protect profits while allowing them to grow.
  2. Adaptive Flexibility: Strategy can adapt to different market conditions through parameter adjustment.
  3. Filtering Mechanism: Uses trade cooldown periods to avoid overtrading and improve trade quality.
  4. Simple but Effective: Strategy logic is clear, easy to understand and execute, while maintaining good scalability.

Strategy Risks

  1. False Breakout Risk: Markets may exhibit false breakouts leading to incorrect signals. Consider adding volume confirmation.
  2. Slippage Impact: During high volatility periods, significant slippage may affect strategy performance.
  3. Parameter Sensitivity: Strategy performance is sensitive to parameter settings, requiring careful optimization.
  4. Market Environment Dependency: May underperform in low volatility environments.

Strategy Optimization Directions

  1. Incorporate Volume Indicators: Add volume confirmation to improve breakout signal reliability.
  2. Add Trend Filters: Combine with long-term trend indicators to trade only in trend direction.
  3. Dynamic Parameter Adjustment: Automatically adjust breakout thresholds and stop-loss parameters based on market volatility.
  4. Multiple Time Periods: Integrate signals from multiple timeframes to improve accuracy.

Summary

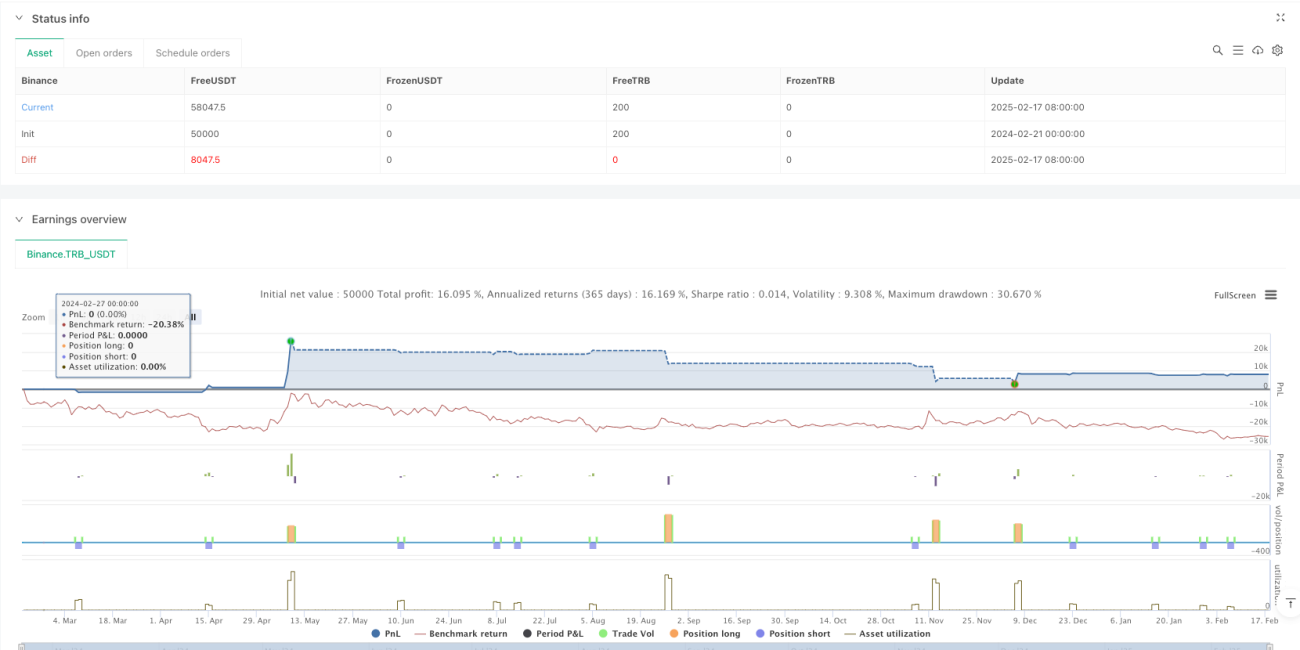
This is a well-designed trend-following strategy that combines price breakouts with dynamic stops to capture major trends while effectively controlling risk. The strategy’s high customizability allows it to adapt to different market environments through parameter optimization. It’s recommended to start with small positions in live trading and gradually verify strategy performance under different market conditions.

Strategy source code
/*backtest
start: 2024-02-21 00:00:00
end: 2025-02-18 08:00:00
period: 2d
basePeriod: 2d
exchanges: [{"eid":"Binance","currency":"TRB_USDT"}]
*/

//@version=5
//TSLA has the buest results on the 5 min or 1 hour chart
//NQ 15 minute
strategy("!! 🔥 Breakout Strategy with Trailing Stop", overlay=true, 
         default_qty_type=strategy.percent_of_equity, default_qty_value=100, 
         pyramiding=100)

// User inputs
var int lookbackBars = input.int(10, title="Lookback Bars", minval=1)
var float breakoutThresholdPct = input.float(0.05, title="Breakout Threshold Percentage", minval=0.0001, maxval=5, step=0.01)
var float stopLossPct = input.float(0.2, title="Stop Loss Percentage", minval=0.1) / 100
// Adjusted: No longer directly using takeProfitPct for a fixed take profit level
var float trailStartPct = input.float(0.5, title="Trail Start at Profit Percentage", minval=0.001) / 100

// Tracking the last entry time
var float lastEntryTime = na

// Calculate the highest high and lowest low over the last N bars excluding the current bar
float previousHigh = ta.highest(high[1], lookbackBars)
float previousLow = ta.lowest(low[1], lookbackBars)


// Entry condition adjusted to compare current price against the previous period's high/low
bool breakoutHigh = close > previousHigh * (1 + breakoutThresholdPct / 100) and (na(lastEntryTime) or (time - lastEntryTime) > 3600000 )
bool breakoutLow = close < previousLow * (1 - breakoutThresholdPct / 100) and (na(lastEntryTime) or (time - lastEntryTime) > 3600000 )

// Execute strategy based on the breakout condition
if (breakoutHigh)
    strategy.entry("Breakout Buy", strategy.long)
    lastEntryTime := time
else if (breakoutLow)
    strategy.entry("Breakout Sell", strategy.short)
    lastEntryTime := time

// Exiting the strategy with a trailing stop that starts after reaching 1% profit
// Adjusted: Implementing a dynamic trailing stop that activates after a 1% profit
if strategy.position_size > 0 
    strategy.exit("Trailing Stop Exit", "Breakout Buy", trail_points = close * trailStartPct, trail_offset = close * stopLossPct)
if strategy.position_size < 0 
    strategy.exit("Trailing Stop Exit", "Breakout Sell", trail_points = close * trailStartPct, trail_offset = close * stopLossPct)

// Visualization for debugging and analysis
plot(previousHigh, color=color.green, linewidth=2, title="Previous High")
plot(previousLow, color=color.red, linewidth=2, title="Previous Low")
// plotshape(series=breakoutHigh, location=location.belowbar, color=color.green, style=shape.labelup, text="BUY")
// plotshape(series=breakoutLow, location=location.abovebar, color=color.red, style=shape.labeldown, text="SELL")