Multi-Indicator Trend Following Strategy with ATR Dynamic Stop Loss/Take Profit

Overview
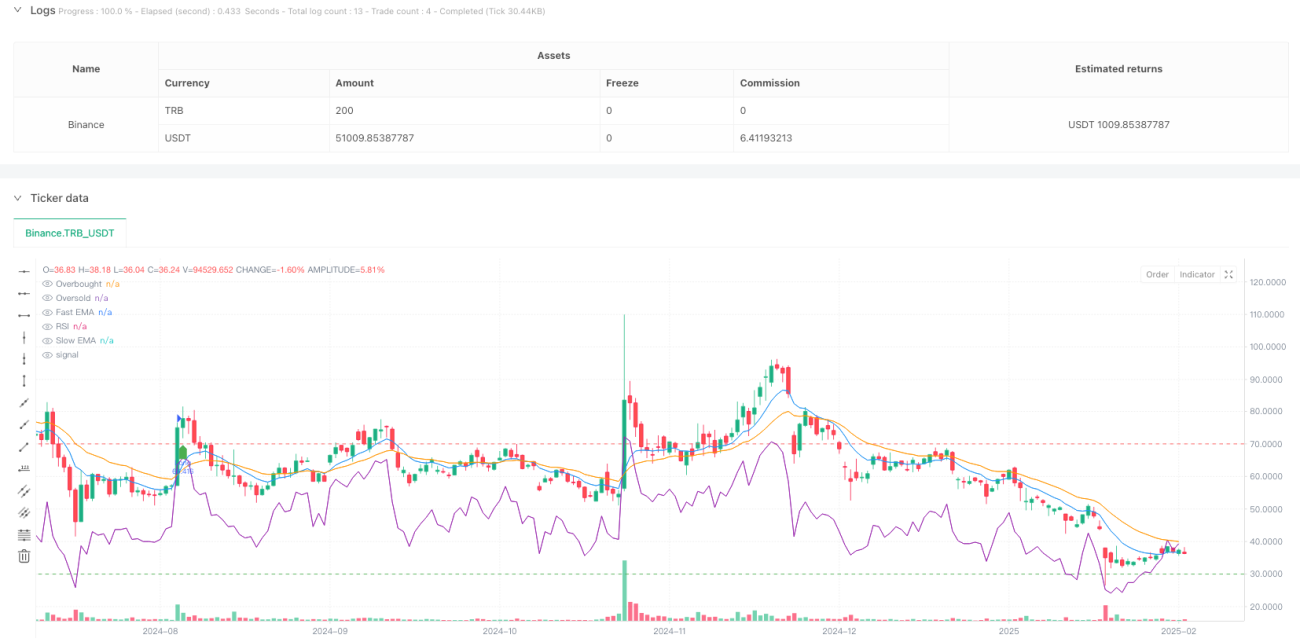
This strategy is a trend-following trading system based on multiple technical indicators. It combines Exponential Moving Averages (EMA), Relative Strength Index (RSI), Volume, and Average True Range (ATR) to determine entry points, while using ATR for dynamic stop-loss and take-profit levels. The strategy also incorporates candle breakout confirmation to enhance signal reliability.
Strategy Principles
The strategy uses the crossover of fast EMA (9-period) and slow EMA (21-period) to capture trend changes. It incorporates RSI (14-period) to filter out overbought and oversold regions, requiring RSI values to be outside overbought (70) and oversold (30) zones. Additionally, the strategy requires volume to be above its 20-period moving average and price to break the previous candle's high/low for confirmation. Once entered, it employs ATR-based dynamic stop-loss (1.5x ATR), take-profit (3x ATR), and trailing stop (1x ATR) mechanisms to protect profits.
Strategy Advantages
- Multiple technical indicators enhance signal reliability
- Dynamic stop-loss and take-profit levels adapt to market volatility
- Trailing stop mechanism effectively protects profits
- Volume confirmation reduces false breakouts
- Candle breakout confirmation increases trade accuracy
- Strategy parameters can be flexibly adjusted for different markets
Strategy Risks
- Multiple indicators may cause missed trading opportunities
- Frequent false signals in ranging markets
- Rapid volatile movements may lead to suboptimal stop-loss placement
- Large gaps may breach stop-loss levels causing unexpected losses
Risk management recommendations:
- Regular optimization of indicator parameters
- Filter trades using higher timeframe trends
- Set daily maximum trade limits
- Implement proper money management plans
Optimization Directions
-
Introduce Adaptive Indicator Parameters:
Automatically adjust EMA and RSI periods based on market volatility for better adaptation to different market conditions. -
Add Market Environment Filters:
Incorporate trend strength indicators like ADX to reduce position size or pause trading in ranging markets. -
Optimize Stop-Loss Strategy:
Consider incorporating support/resistance levels for more effective stop-loss placement. -
Enhance Position Sizing:
Dynamically adjust position sizes based on market volatility and liquidity.
Summary
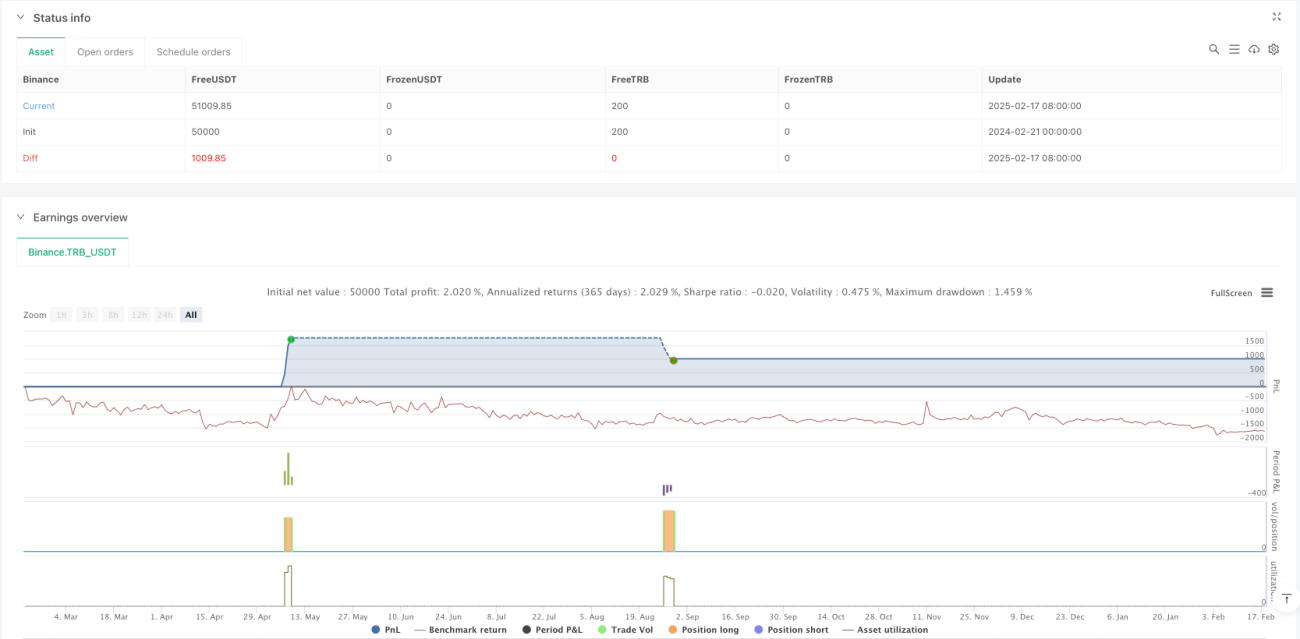
This is a well-structured trend-following strategy with solid logic. The combination of multiple technical indicators ensures reliable trading signals while effectively controlling risks. The dynamic stop-loss and take-profit settings provide favorable risk-reward ratios. The strategy has significant optimization potential and can be continuously improved to adapt to various market conditions.
/*backtest
start: 2024-02-21 00:00:00
end: 2025-02-18 08:00:00
period: 1d
basePeriod: 1d
exchanges: [{"eid":"Binance","currency":"TRB_USDT"}]
*/

//@version=6
strategy("15m EMA RSI Strategy with ATR SL/TP and Candle Break Confirmation", overlay=true, initial_capital=100000, default_qty_type=strategy.percent_of_equity, default_qty_value=10)

// INPUTS- 1