Overview
This strategy is a comprehensive technical analysis system that combines multiple candlestick patterns and trendline patterns for generating trading signals. The strategy identifies market turning points by recognizing various classic candlestick patterns (such as engulfing patterns, hammers, morning stars, etc.) and chart patterns (such as double tops/bottoms, triangles, flags, etc.). It also incorporates head and shoulders pattern recognition to provide more comprehensive technical analysis support for trading decisions.
Strategy Principles
The strategy is based on several core components: 1. Candlestick pattern recognition system, including multiple classic bullish and bearish patterns such as engulfing patterns, hammers, hanging men, morning stars, evening stars, piercing lines, dark cloud covers, and harami patterns. 2. Trendline pattern analysis system for identifying double tops/bottoms, symmetrical triangles, ascending triangles, descending triangles, flags, pennants, and channels. 3. Special pattern recognition system specifically designed to identify complex patterns like head and shoulders and inverse head and shoulders. 4. Risk management system that controls trading risk through stop-loss and take-profit settings.
Strategy Advantages
- Multi-dimensional analysis: Provides a more comprehensive market analysis perspective by combining multiple technical indicators and chart patterns.
- Robust risk control: Built-in stop-loss and take-profit mechanisms effectively control risk for each trade.
- Accurate pattern recognition: Ensures pattern recognition accuracy through strict mathematical calculations and condition checking.
- High adaptability: Strategy can operate in different market environments and time periods.
- Visual support: Provides clear graphical markers to help traders intuitively understand market conditions.
Strategy Risks
- False breakout risk: May generate false signals in ranging markets, leading to incorrect trades.
- Lag risk: Pattern recognition has inherent lag, which may affect entry timing.
- Market environment dependency: Strategy effectiveness may decrease in highly volatile or trendless market conditions.
- Parameter sensitivity: Multiple judgment conditions depend on parameter settings, improper parameter selection may affect strategy performance.
Strategy Optimization Directions
- Incorporate volume-price relationship analysis: Combine volume indicators to improve pattern recognition reliability.
- Optimize stop-loss settings: Dynamically adjust stop-loss distances based on volatility.
- Add trend filters: Introduce trend judgment indicators to avoid excessive trading in ranging markets.
- Enhance risk management: Add position time limits and maximum loss limits as additional risk control measures.
- Add market environment recognition: Develop market condition judgment modules to adjust strategy parameters under different market conditions.
Summary
This strategy builds a complete trading system by comprehensively applying multiple technical analysis methods. Its strengths lie in multi-dimensional analysis and comprehensive risk control, while also facing risks such as false breakouts and time lag. Through continuous optimization and improvement, the strategy has the potential to achieve better performance in actual trading. Traders are advised to conduct thorough backtesting and parameter optimization before live trading, and flexibly adjust strategy parameters according to actual market conditions.
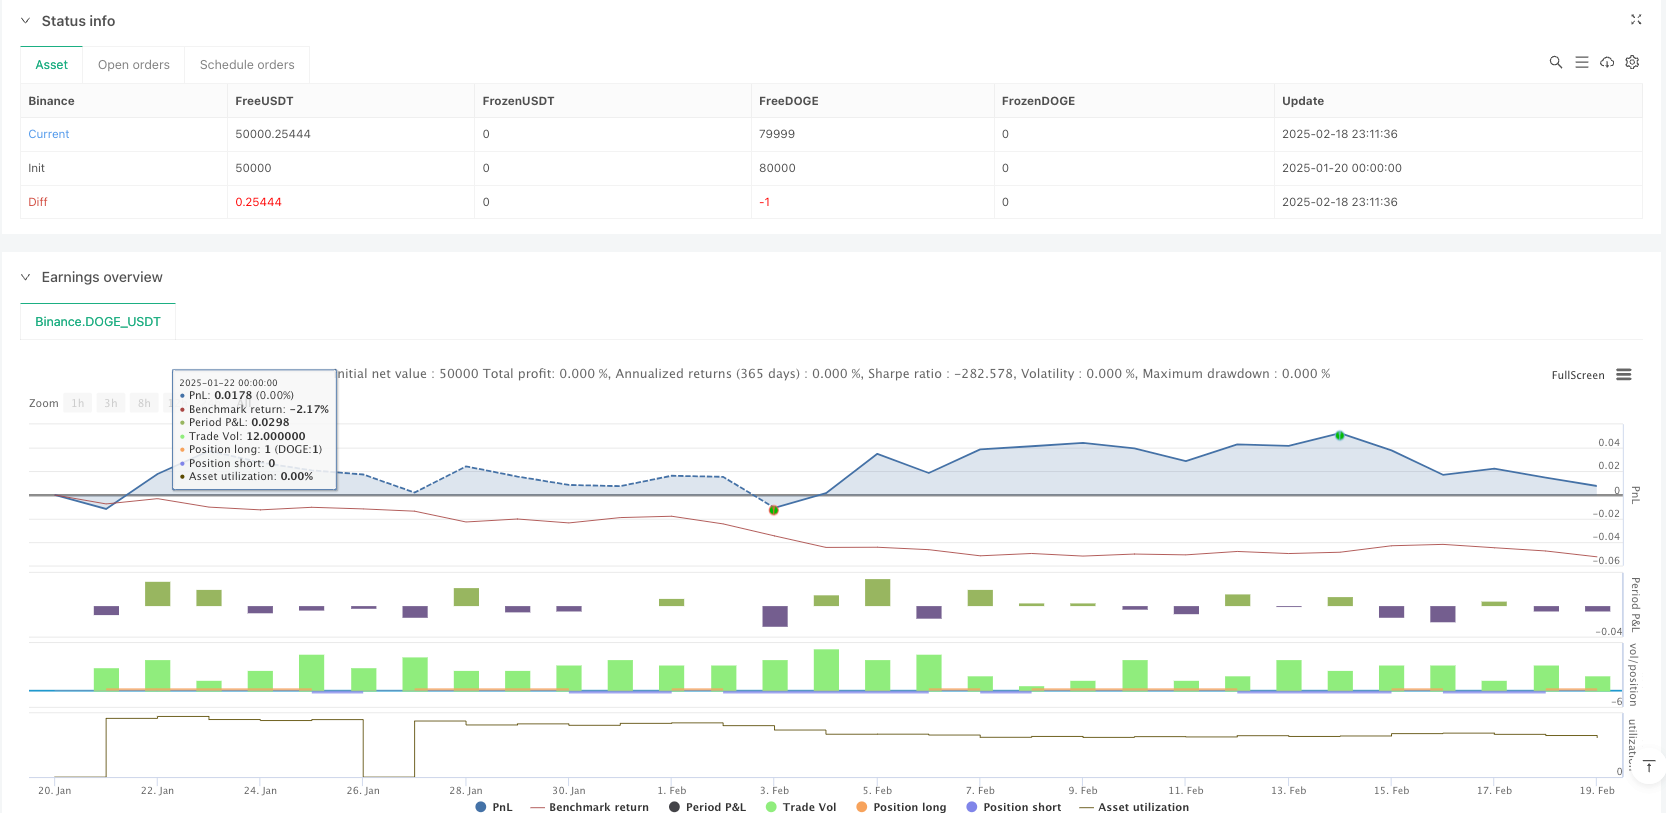
/*backtest
start: 2025-01-20 00:00:00
end: 2025-02-19 00:00:00
period: 1h
basePeriod: 1h
exchanges: [{"eid":"Binance","currency":"DOGE_USDT"}]
*/
//@version=6
strategy("Advanced Candlestick and Line Chart Patterns with Head and Shoulders", overlay=true)
// --- Candlestick Patterns ---
isBullishEngulfing = close > open[1] and open < close[1]
isBearishEngulfing = close < open[1] and open > close[1]
isHammer = (high - low) > 2 * (open - close) and (close - low) / (0.001 + high - low) > 0.6 and (open - low) / (0.001 + high - low) > 0.6
isHangingMan = isHammer and close < open
isDoji = math.abs(close - open) <= 0.1 * (high - low)
isMorningStar = close[2] < open[2] and close[1] > open[1] and close > open and close > close[2] and open[1] > close[2]
isEveningStar = close[2] > open[2] and close[1] < open[1] and close < open and close < close[2] and open[1] < close[2]
isPiercingLine = close > open and close[1] < open[1] and close > open[1] and open < close[1]
isDarkCloudCover = close < open and close[1] > open[1] and close < open[1] and open > close[1]
isBullishHarami = close > open[1] and open < close[1] and close > open and close[1] > open
isBearishHarami = close < open[1] and open > close[1] and close < open and close[1] < open
// --- Line Chart Patterns ---
// Double Top and Double Bottom
doubleTop = (high[2] > high[1] and high[1] < high and close < open[1])
doubleBottom = (low[2] < low[1] and low[1] > low and close > open[1])
// Symmetrical Triangles
symmetricalTriangle = (high[2] > high[1] and low[2] < low[1] and high > high[1] and low > low[1])
// Ascending Triangle
ascendingTriangle = (high[2] < high[1] and low[2] > low[1] and high > high[1] and low > low[1])
// Descending Triangle
descendingTriangle = (high[2] > high[1] and low[2] < low[1] and high < high[1] and low < low[1])
// Flags and Pennants
isFlag = (high[1] > high[2] and low[1] > low[2] and high < high[1] and low < low[1])
isPennant = (high[2] < high[1] and low[2] > low[1] and high > high[1] and low < low[1])
// Channel Formation
isChannel = (high[2] > high[1] and low[2] < low[1] and high > high[1] and low < low[1])
// Diamond Pattern
isDiamond = (high[2] < high[1] and low[2] > low[1] and high > high[1] and low < low[1] and high[1] < high and low[1] > low)
// --- Head and Shoulders Patterns ---
// Head and Shoulders
isHeadAndShoulders = high[2] > high[1] and high[1] < high and close < open[1]
// Inverse Head and Shoulders
isInverseHeadAndShoulders = low[2] < low[1] and low[1] > low and close > open[1]
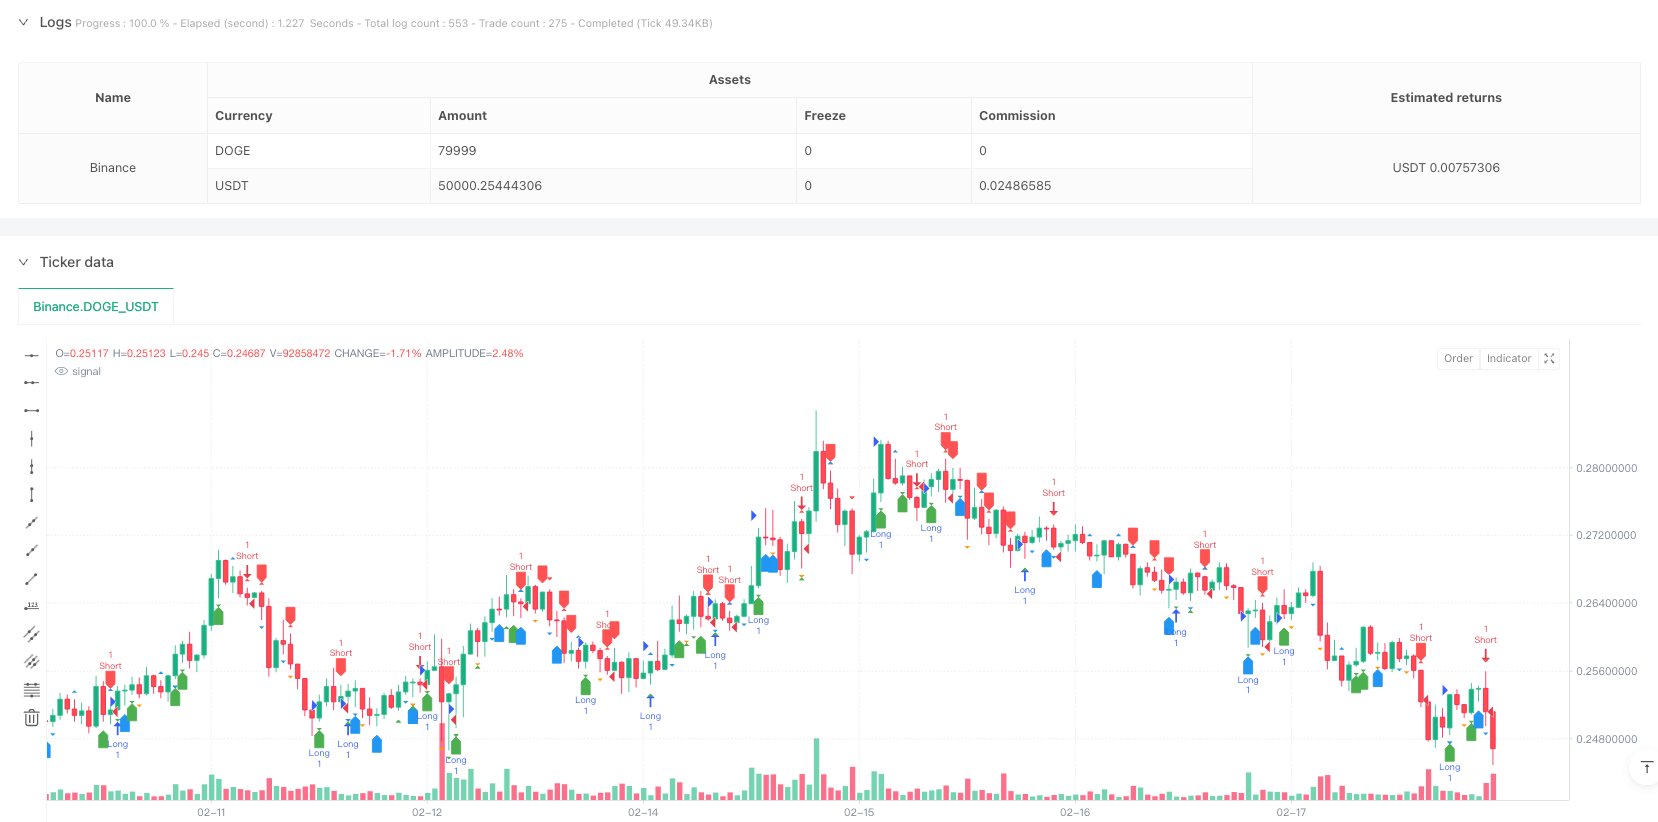
// --- Visual Representation ---
plotshape(series=isBullishEngulfing, location=location.belowbar, color=color.green, style=shape.labelup, title="Bullish Engulfing")
plotshape(series=isBearishEngulfing, location=location.abovebar, color=color.red, style=shape.labeldown, title="Bearish Engulfing")
plotshape(series=isHammer, location=location.belowbar, color=color.green, style=shape.triangledown, title="Hammer")
plotshape(series=isHangingMan, location=location.abovebar, color=color.red, style=shape.triangleup, title="Hanging Man")
plotshape(series=isDoji, location=location.belowbar, color=color.blue, style=shape.labelup, title="Doji")
plotshape(series=isMorningStar, location=location.belowbar, color=color.green, style=shape.triangledown, title="Morning Star")
plotshape(series=isEveningStar, location=location.abovebar, color=color.red, style=shape.triangleup, title="Evening Star")
plotshape(series=isPiercingLine, location=location.belowbar, color=color.green, style=shape.triangleup, title="Piercing Line")
plotshape(series=isDarkCloudCover, location=location.abovebar, color=color.red, style=shape.triangledown, title="Dark Cloud Cover")
plotshape(series=isBullishHarami, location=location.belowbar, color=color.green, style=shape.triangledown, title="Bullish Harami")
plotshape(series=isBearishHarami, location=location.abovebar, color=color.red, style=shape.triangleup, title="Bearish Harami")
// Line Chart Pattern Visualization
plotshape(series=doubleTop, location=location.abovebar, color=color.red, style=shape.triangledown, title="Double Top")
plotshape(series=doubleBottom, location=location.belowbar, color=color.green, style=shape.triangleup, title="Double Bottom")
plotshape(series=symmetricalTriangle, location=location.belowbar, color=color.blue, style=shape.triangledown, title="Symmetrical Triangle")
plotshape(series=ascendingTriangle, location=location.belowbar, color=color.blue, style=shape.triangledown, title="Ascending Triangle")
plotshape(series=descendingTriangle, location=location.abovebar, color=color.blue, style=shape.triangleup, title="Descending Triangle")
plotshape(series=isFlag, location=location.belowbar, color=color.orange, style=shape.triangledown, title="Flag")
plotshape(series=isPennant, location=location.belowbar, color=color.purple, style=shape.triangledown, title="Pennant")
plotshape(series=isChannel, location=location.belowbar, color=color.blue, style=shape.triangledown, title="Channel")
plotshape(series=isDiamond, location=location.abovebar, color=color.blue, style=shape.triangledown, title="Diamond")
// Head and Shoulders Pattern Visualization
plotshape(series=isHeadAndShoulders, location=location.abovebar, color=color.red, style=shape.triangledown, title="Head and Shoulders")
plotshape(series=isInverseHeadAndShoulders, location=location.belowbar, color=color.green, style=shape.triangleup, title="Inverse Head and Shoulders")
// --- Strategy Logic ---
longCondition = isBullishEngulfing or isHammer or isMorningStar or isPiercingLine or isBullishHarami or doubleBottom or isInverseHeadAndShoulders
shortCondition = isBearishEngulfing or isHangingMan or isEveningStar or isDarkCloudCover or isBearishHarami or doubleTop or isHeadAndShoulders
if (longCondition)
strategy.entry("Long", strategy.long)
if (shortCondition)
strategy.entry("Short", strategy.short)
// Stop-Loss and Take-Profit
strategy.exit("Take Profit/Stop Loss", "Long", stop=low - 10, limit=high + 10)
strategy.exit("Take Profit/Stop Loss", "Short", stop=high + 10, limit=low - 10)