Triple EMA and Fisher Transform Trend Momentum Strategy

Overview
This strategy combines the Triple Exponential Moving Average (TEMA) and Fisher Transform indicators to identify trend and momentum signals for entry and exit timing. TEMA serves as a low-lag trend following indicator for effective trend direction identification, while Fisher Transform converts price movements into a Gaussian normal distribution for clearer momentum signals. The strategy uses crossover signals as trading triggers, combining the advantages of trend following and momentum analysis.
Strategy Principles
The core logic is built on two main indicators:
- TEMA uses a triple exponential moving average calculation method, reducing the lag of traditional moving averages through the formula "3×EMA - 3×EMA(EMA) + EMA(EMA(EMA))", with a default period of 21.
- Fisher Transform converts price data into a normal distribution with a default parameter of 10, applying logarithmic transformation after normalizing high-low prices for clearer signals.
Trading rules are:
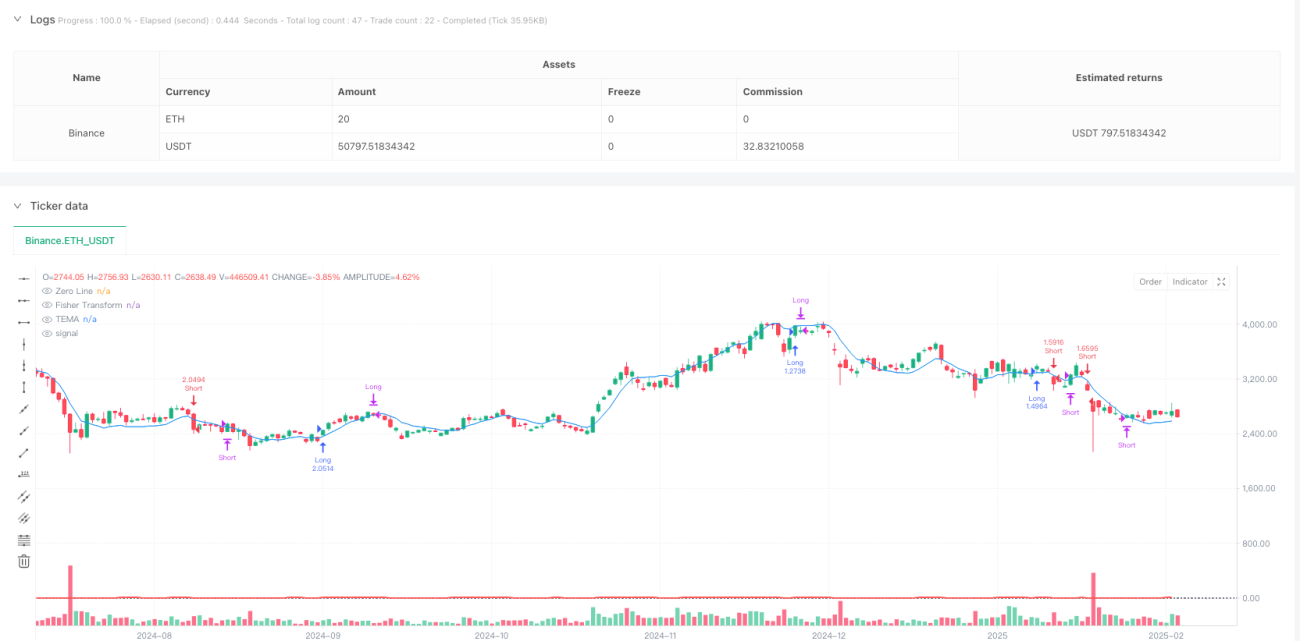
- Long Entry: Price crosses above TEMA and Fisher Transform crosses above 0
- Short Entry: Price crosses below TEMA and Fisher Transform crosses below 0
- Long Exit: Price crosses below TEMA or Fisher Transform crosses below 0
- Short Exit: Price crosses above TEMA or Fisher Transform crosses above 0
Strategy Advantages
- High Signal Reliability: Effectively filters false signals by combining trend and momentum indicators
- Low Latency: TEMA provides faster response compared to traditional moving averages
- Clear Signals: Fisher Transform's normal distribution characteristics provide clearer trading signals
- Robust Risk Control: Implements clear stop-loss conditions
- Adjustable Parameters: Can be tuned for different market conditions
- Good Visualization: Provides clear chart display
Strategy Risks
- Choppy Market Risk: May generate frequent false breakout signals in sideways markets
- Lag Risk: Though reduced, some degree of delay still exists
- Parameter Sensitivity: Different parameter settings may lead to varying strategy performance
- Market Environment Dependence: Strategy performs better in trending markets
Strategy Optimization Directions
- Introduce Volatility Filter: Add ATR indicator to filter signals in low volatility environments
- Optimize Exit Mechanism: Consider adding trailing stops or profit protection mechanisms
- Add Time Filters: Adjust trading strategy based on different time period characteristics
- Include Volume Confirmation: Incorporate volume indicators to improve signal reliability
- Dynamic Parameter Optimization: Adjust indicator parameters based on market conditions
Summary
This is a comprehensive trading strategy combining trend and momentum analysis. Through the complementary use of TEMA and Fisher Transform, it ensures trend following capability while providing clear momentum confirmation signals. The strategy design is rational and practical, but attention must be paid to market environment adaptability and parameter optimization in actual application. Through the suggested optimization directions, the strategy's stability and reliability can be further enhanced.
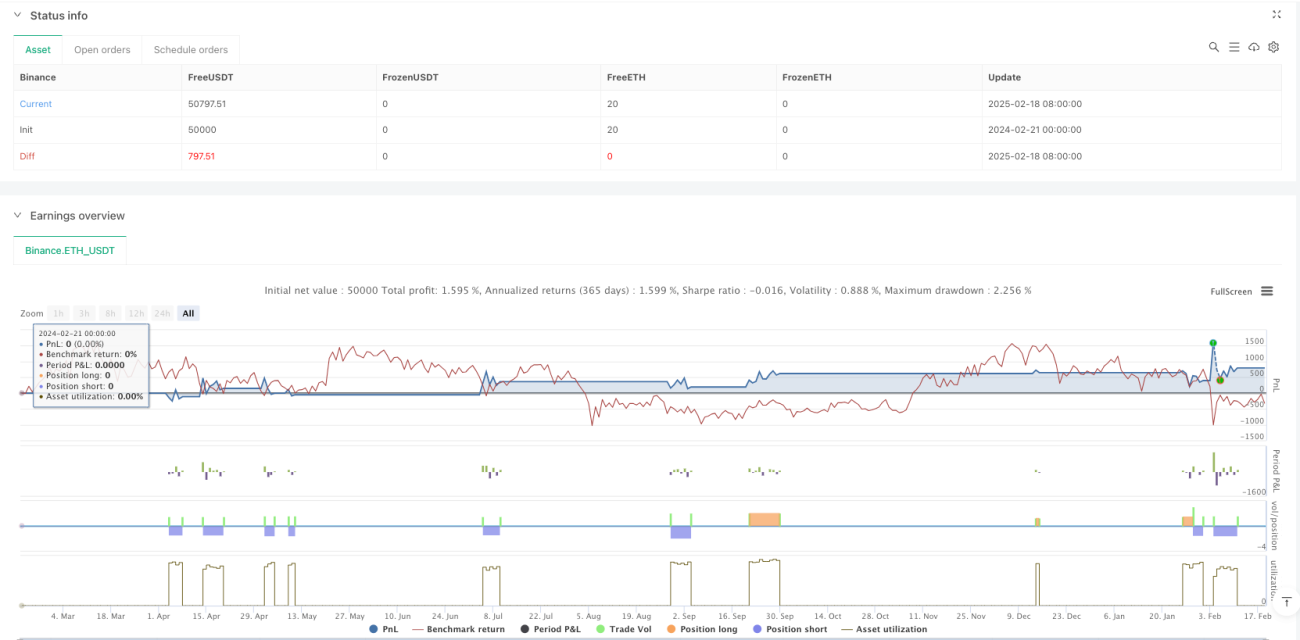
/*backtest
start: 2024-02-21 00:00:00
end: 2025-02-19 00:00:00
period: 1d
basePeriod: 1d
exchanges: [{"eid":"Binance","currency":"ETH_USDT"}]
*/

//@version=5
strategy("Triple EMA (TEMA) + Fisher Transform Strategy", overlay=true, default_qty_type=strategy.percent_of_equity, default_qty_value=10)

// ==== Triple EMA (TEMA) Settings ====- 1