Dual Moving Average Trend Following and Risk Management Trading Strategy

Overview
This strategy is an automated trading system that combines multi-timeframe trend following with risk management. It primarily uses Exponential Moving Averages (EMA) on 5-minute and 1-minute timeframes to identify trading opportunities, while implementing fixed percentage stops and targets for risk control. The strategy is particularly suitable for short-term traders, especially those focused on trend following.
Strategy Principles
The core logic is based on trend determination across two timeframes:
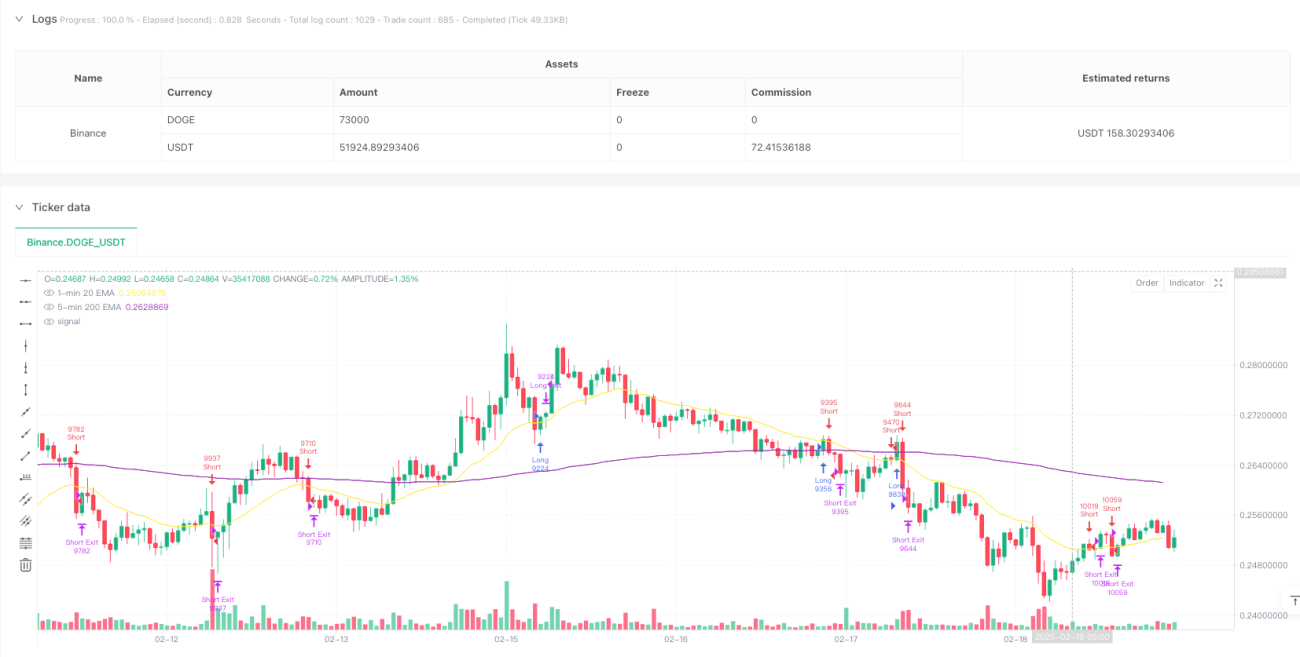
- Uses a 200-period EMA on the 5-minute timeframe as the main trend filter, allowing long positions only above this line and short positions only below it.
- On the 1-minute timeframe, a 20-period EMA serves as the entry trigger. Long signals are generated when price crosses above this EMA, and short signals when it crosses below.
- Risk management employs a fixed percentage approach, with stops set at 0.5% from entry price and profit targets at twice the stop distance, creating a 1:2 risk-reward ratio.
Strategy Advantages
- Multi-timeframe analysis provides more reliable trend identification, reducing false breakout risks.
- Fixed percentage risk management approach ensures systematic capital management.
- 1:2 risk-reward ratio can generate profits even with a 40% win rate.
- Simple and clear strategy logic makes it easy to understand and execute.
- Visual trade signal markers facilitate backtesting verification.
Strategy Risks
- Rapid oscillating markets may generate frequent false signals.
- The 0.5% stop loss might be too tight during low volatility periods.
- Reliance on EMA crossovers can lead to lag in signal generation.
- High-frequency trading may incur significant transaction costs.
- Quick market reversals could result in substantial drawdowns.
Strategy Optimization Directions
- Incorporate volatility indicators for dynamic stop loss adjustment.
- Add volume confirmation to improve entry quality.
- Consider adding trend strength indicators like ADX to filter weak trends.
- Implement oscillators like RSI for ranging market signal filtration.
- Develop dynamic risk-reward ratios based on market characteristics.
Summary
This is a well-structured trend following strategy with clear logic. By combining multi-timeframe analysis with strict risk management, the strategy effectively captures market trends while protecting capital. While there is room for optimization, the basic framework is robust and serves as an excellent foundation for further improvements and customization.
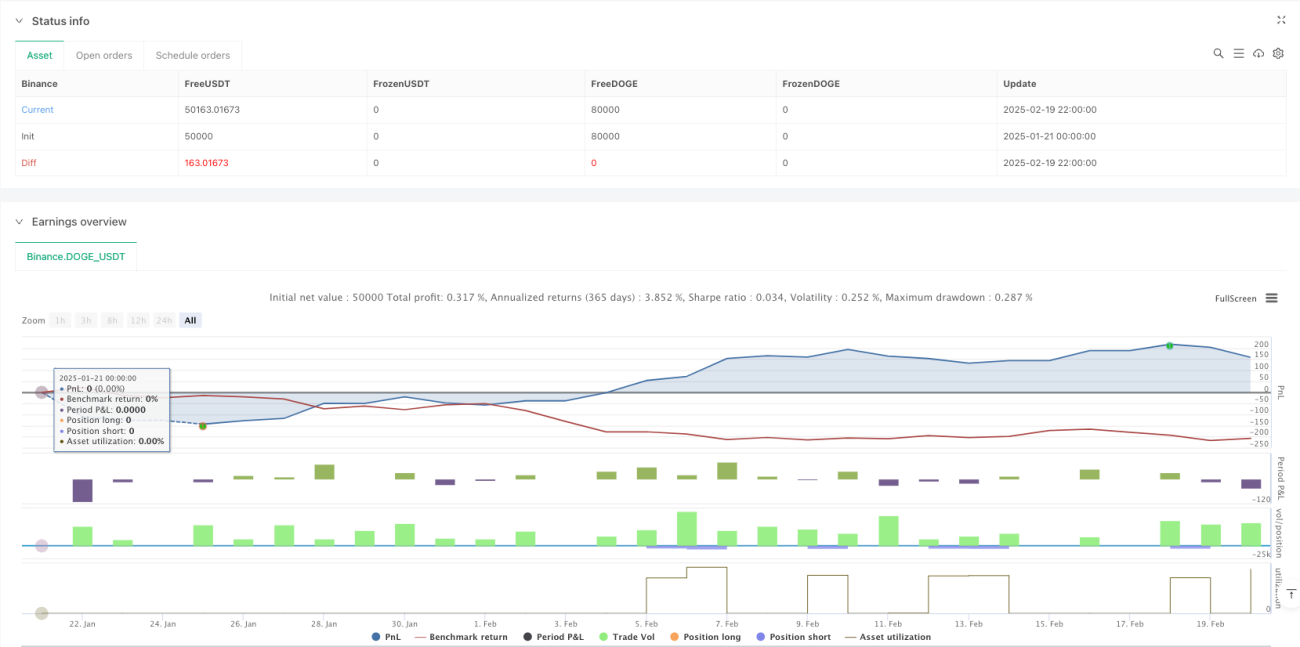
/*backtest
start: 2025-01-21 00:00:00
end: 2025-02-20 00:00:00
period: 1h
basePeriod: 1h
exchanges: [{"eid":"Binance","currency":"DOGE_USDT"}]
*/

//@version=5
strategy("Scalping Strategy: 1-min Entries with 5-min 200 EMA Filter", overlay=true, initial_capital=10000, currency=currency.USD, default_qty_type=strategy.percent_of_equity, default_qty_value=5, calc_on_every_tick=true)

// --- Higher Timeframe Trend Filter ---- 1