Dynamic Trend RSI Crossover Momentum Enhancement Strategy

Overview
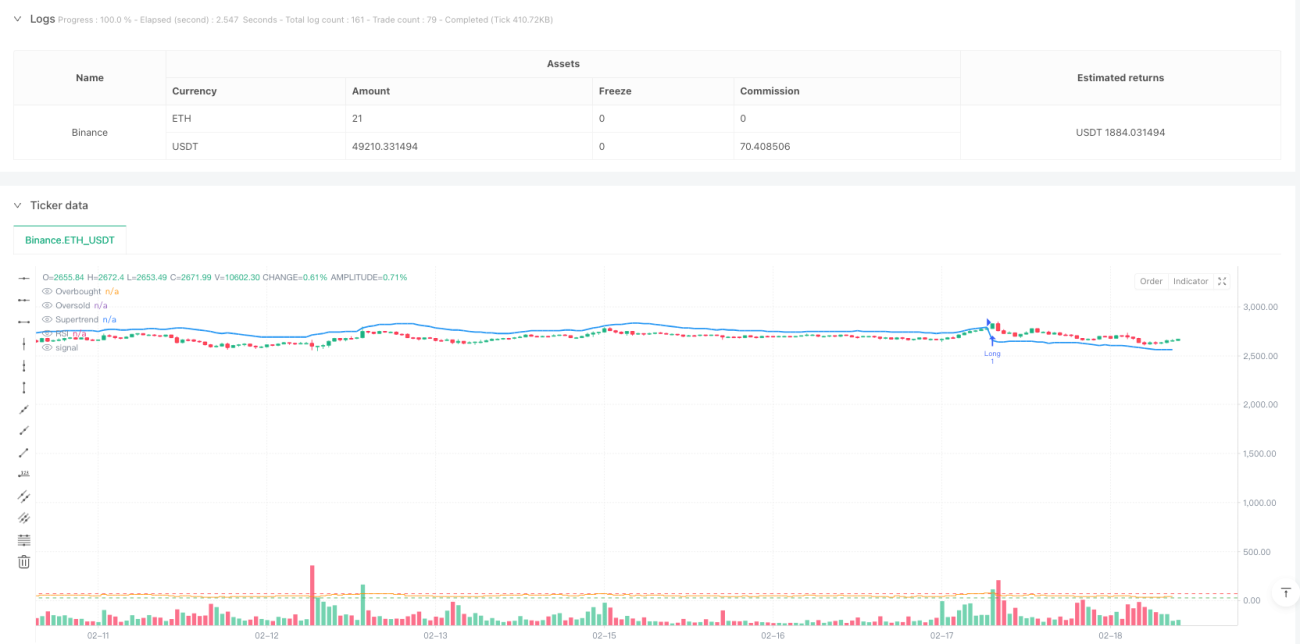
This strategy combines the Supertrend trend indicator with the RSI (Relative Strength Index) to create a trading system. It integrates trend following with momentum indicators to execute trades when market trends are clear and show good momentum. The system uses ATR (Average True Range) to calculate dynamic support and resistance levels, combined with RSI overbought/oversold signals for entry timing.
Strategy Principles
The core logic of the strategy is based on several key elements:
- Supertrend indicator calculation is based on ATR and SMA, used to determine current market trend. The upper band is calculated by adding the factor multiplied by ATR to SMA, while the lower band subtracts the same value.
- Buy signals are generated when price is above the Supertrend line, sell signals when below.
- RSI indicator confirms market momentum, filtering trade signals through overbought/oversold levels (default 70 and 30).
- Long conditions require Supertrend showing buy signal and RSI crossing upward from oversold zone.
- Short conditions need Supertrend showing sell signal and RSI crossing downward from overbought zone.
- Stop loss is set at the Supertrend line, take profit at 2x ATR distance.
Strategy Advantages
- Combines trend and momentum confirmation, reducing false signal probability.
- Uses dynamic ATR for stop loss and take profit, adapting to different market conditions.
- Supertrend indicator effectively tracks trends, reducing ineffective trades in ranging markets.
- RSI filter helps avoid entries in overextended markets.
- System includes comprehensive risk management with dynamic stops and fixed risk ratio profit targets.
Strategy Risks
- May generate frequent false breakout signals in sideways markets.
- RSI overbought/oversold boundaries may not be flexible enough for certain market conditions.
- Fixed ATR multiplier may not suit all market environments.
- Stop loss placement may result in larger losses during quick reversals.
- Strategy may face slippage risks during high volatility periods.
Strategy Optimization Directions
- Introduce adaptive RSI thresholds, dynamically adjusting overbought/oversold levels based on market volatility.
- Add volume confirmation mechanism to improve signal reliability.
- Implement dynamic ATR multiplier adjustment to better match current market characteristics.
- Include time filters to avoid trading during high volatility periods like market open/close.
- Consider adding market environment filters, using different parameters based on trend strength.
Summary
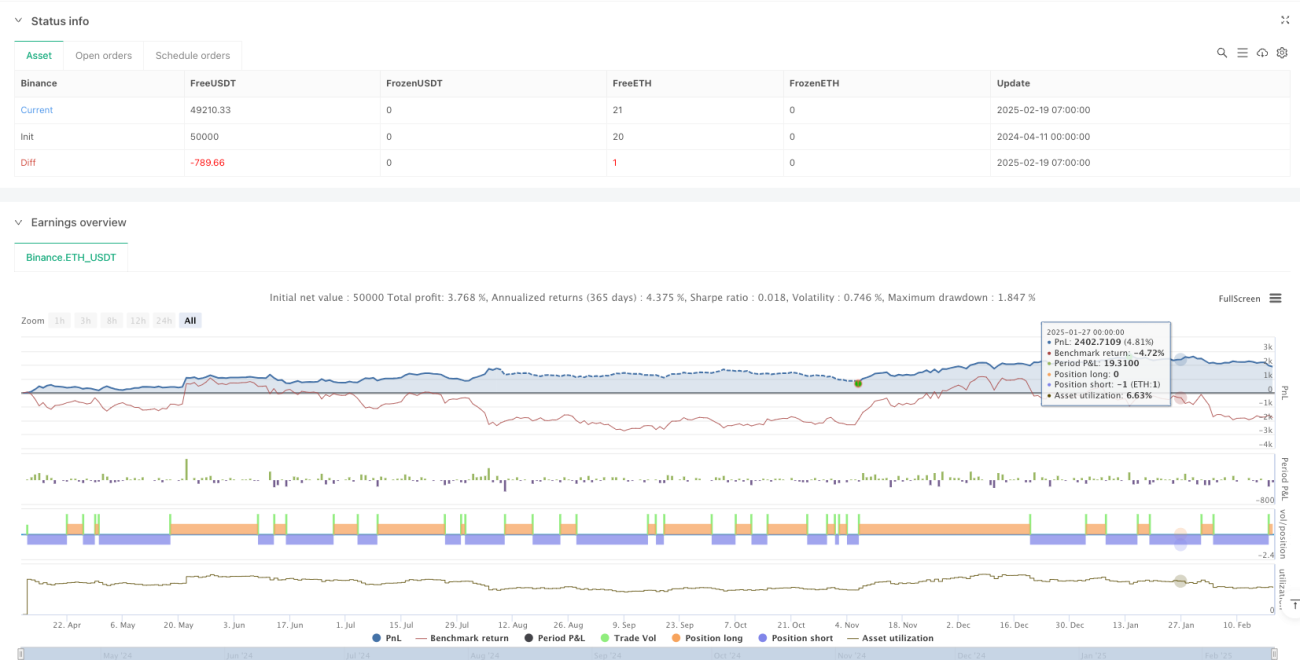
The strategy combines Supertrend and RSI indicators to build a complete trend-following trading system. It performs well in trending markets, controlling risk through dynamic stops and reasonable profit targets. While it has some limitations, the proposed optimization directions can further enhance strategy stability and adaptability. The strategy is suitable for tracking medium to long-term trends while maintaining profitability with good risk control.
- 1