
Overview
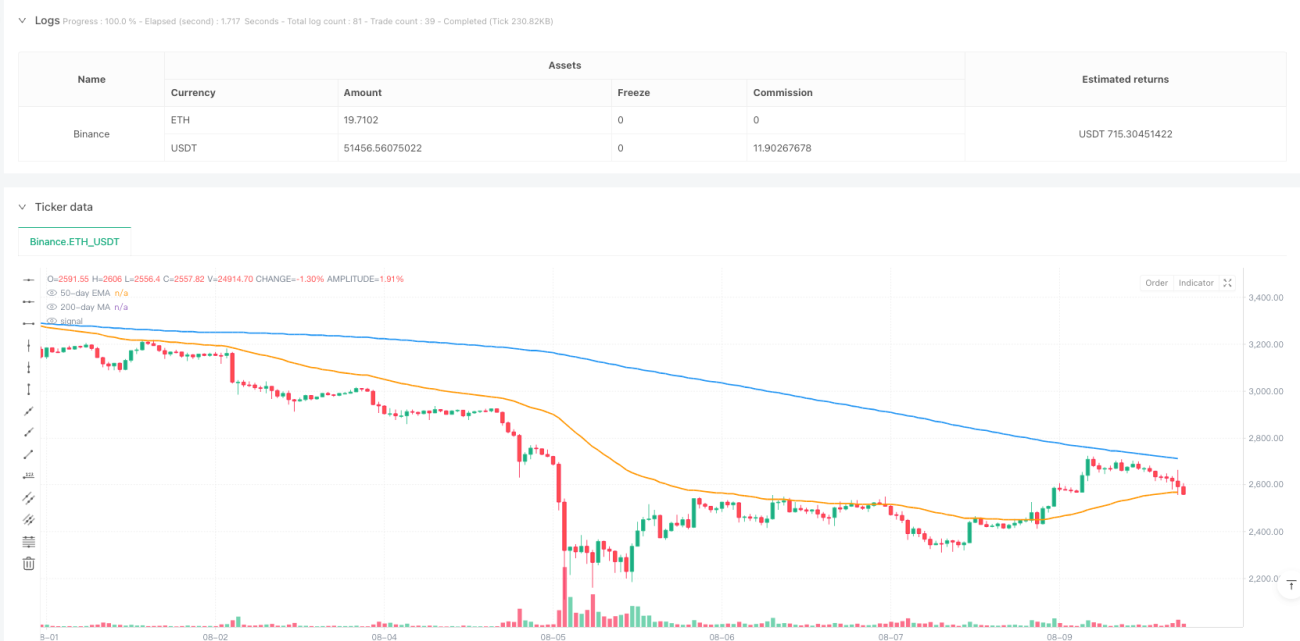
This strategy is a trend-following momentum trading system that combines multiple technical indicators. It primarily uses the 200-day Moving Average (MA200) to determine the main trend direction, utilizes the 50-day Exponential Moving Average (EMA50) to identify pullback opportunities, and combines the Relative Strength Index (RSI) and Moving Average Convergence Divergence (MACD) crossover signals to determine entry timing. The strategy also includes risk management mechanisms through setting risk-reward ratios and trailing stops to protect profits.
Strategy Principles
The core logic of the strategy is to improve trading accuracy through multiple filtering mechanisms. First, MA200 is used to determine the market's main trend, with prices above MA200 indicating a bullish trend and vice versa. After determining the trend direction, the strategy looks for pullback opportunities near EMA50, requiring the price to touch EMA50 within the last 5 periods. Meanwhile, RSI is used for momentum confirmation, requiring RSI above 50 in bullish trends and below 50 in bearish trends. Finally, MACD crossovers serve as specific entry signals. For exits, the strategy employs fixed stop-loss and take-profit levels based on risk-reward ratios, with an optional trailing stop feature.
Strategy Advantages
- Multiple indicators provide collaborative verification, improving trading reliability
- Combines trend and momentum factors to capture major market movements
- Pullback entry mechanism reduces the risk of chasing highs
- Flexible stop-loss mechanism protects capital while capturing significant trends
- Strong parameter adjustability adapts to different market environments
- Clear strategy logic, easy to understand and execute
Strategy Risks
- Multiple indicator filtering may cause missed trading opportunities
- May generate frequent false signals in ranging markets
- Moving averages have inherent lag, potentially affecting entry timing
- Fixed risk-reward ratios may perform differently across market environments
- Parameter optimization may lead to overfitting risk
Strategy Optimization Directions
- Introduce volatility indicators for dynamic risk-reward ratio adjustment
- Add market environment filtering to identify trending and ranging markets
- Optimize pullback detection logic to improve entry timing accuracy
- Add volume confirmation mechanism to enhance signal reliability
- Develop adaptive parameter system to improve strategy robustness
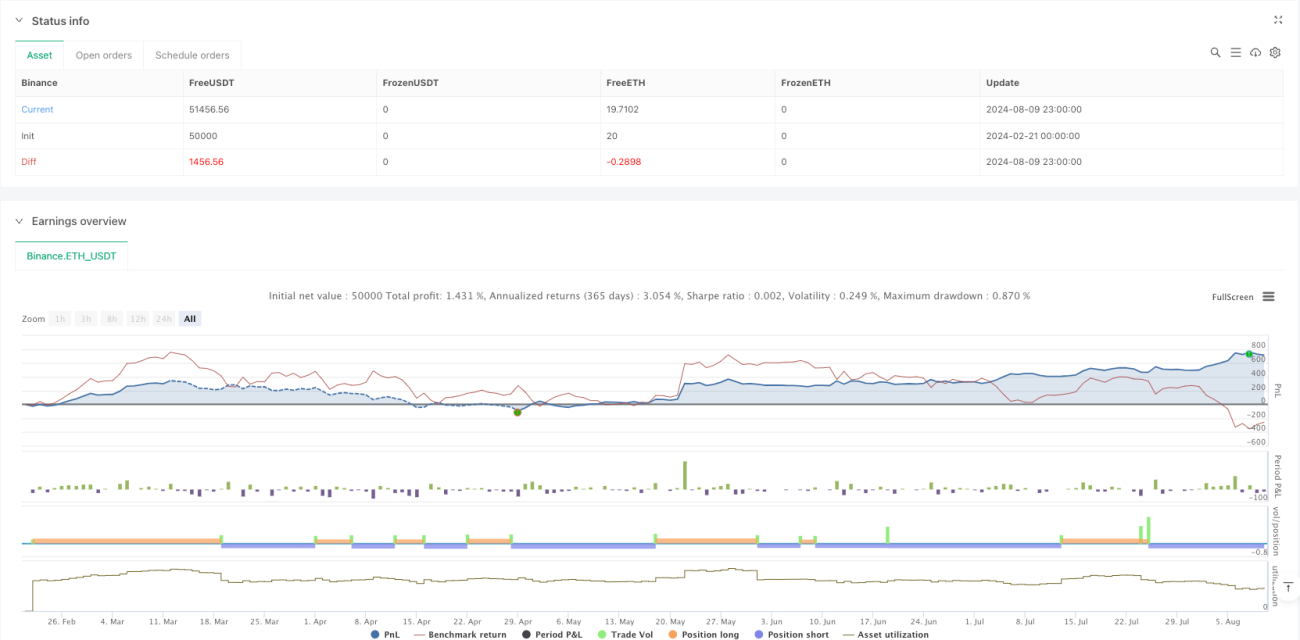
Summary
This strategy constructs a complete trend-following trading system through the comprehensive use of multiple technical indicators. Its strength lies in multiple signal confirmations improving trading reliability, while risk management mechanisms provide good protection. Although some inherent risks exist, the suggested optimization directions can further enhance strategy performance. Overall, this is a logically rigorous and practical quantitative trading strategy.
- 1