Overview
This strategy is a multi-timeframe trading system based on the MACD indicator and moving averages. It combines MACD indicators from 1-minute and 3-minute timeframes, along with a 200-period EMA as a trend filter, to capture market trend continuations. The strategy includes risk management mechanisms, including stop-loss settings and dynamic break-even adjustments.
Strategy Principles
The core logic of the strategy is based on several key elements: 1. Using MACD indicators from both 1-minute and 3-minute timeframes to confirm trend continuation 2. Using 200-period EMA as the main trend determination reference 3. Combining price and moving average relationships to filter trading signals 4. Trading based on session time filters
Specific signal generation rules: - Long signals: MACD line crosses above signal line above zero, confirmed by 3-minute MACD, price above EMA200 - Short signals: MACD line crosses below signal line below zero, confirmed by 3-minute MACD, price below EMA200
Strategy Advantages
- Multi-timeframe confirmation improves trading accuracy
- Trend filter reduces false signals
- Includes comprehensive risk control mechanisms
- Time filters avoid trading during inactive sessions
- Dynamic break-even adjustments protect acquired profits
- Clear strategy logic, easy to adjust and optimize
Strategy Risks
- Slippage risk in high volatility markets
- Multiple confirmation requirements may miss some trading opportunities
- Fixed stop-loss points may lack flexibility in certain market conditions
- Need to consider the impact of trading costs on strategy returns
- Potential for significant drawdowns in volatile markets
Risk control suggestions: - Adjust stop-loss distance based on market volatility - Consider adding profit targets to secure gains - Pause trading during major economic data releases - Regularly evaluate and adjust strategy parameters
Strategy Optimization Directions
- Dynamic MACD parameter adjustment:
- Self-adaptive adjustment based on market volatility
- Consider using adaptive moving averages
- Improve time filters:
- Refine trading session divisions
- Optimize trading times using volume analysis
- Optimize stop-loss mechanism:
- Introduce dynamic stop-loss
- Set stop-loss distances based on ATR
- Enhance trend filtering:
- Add more technical indicators for confirmation
- Consider incorporating price action analysis
Summary
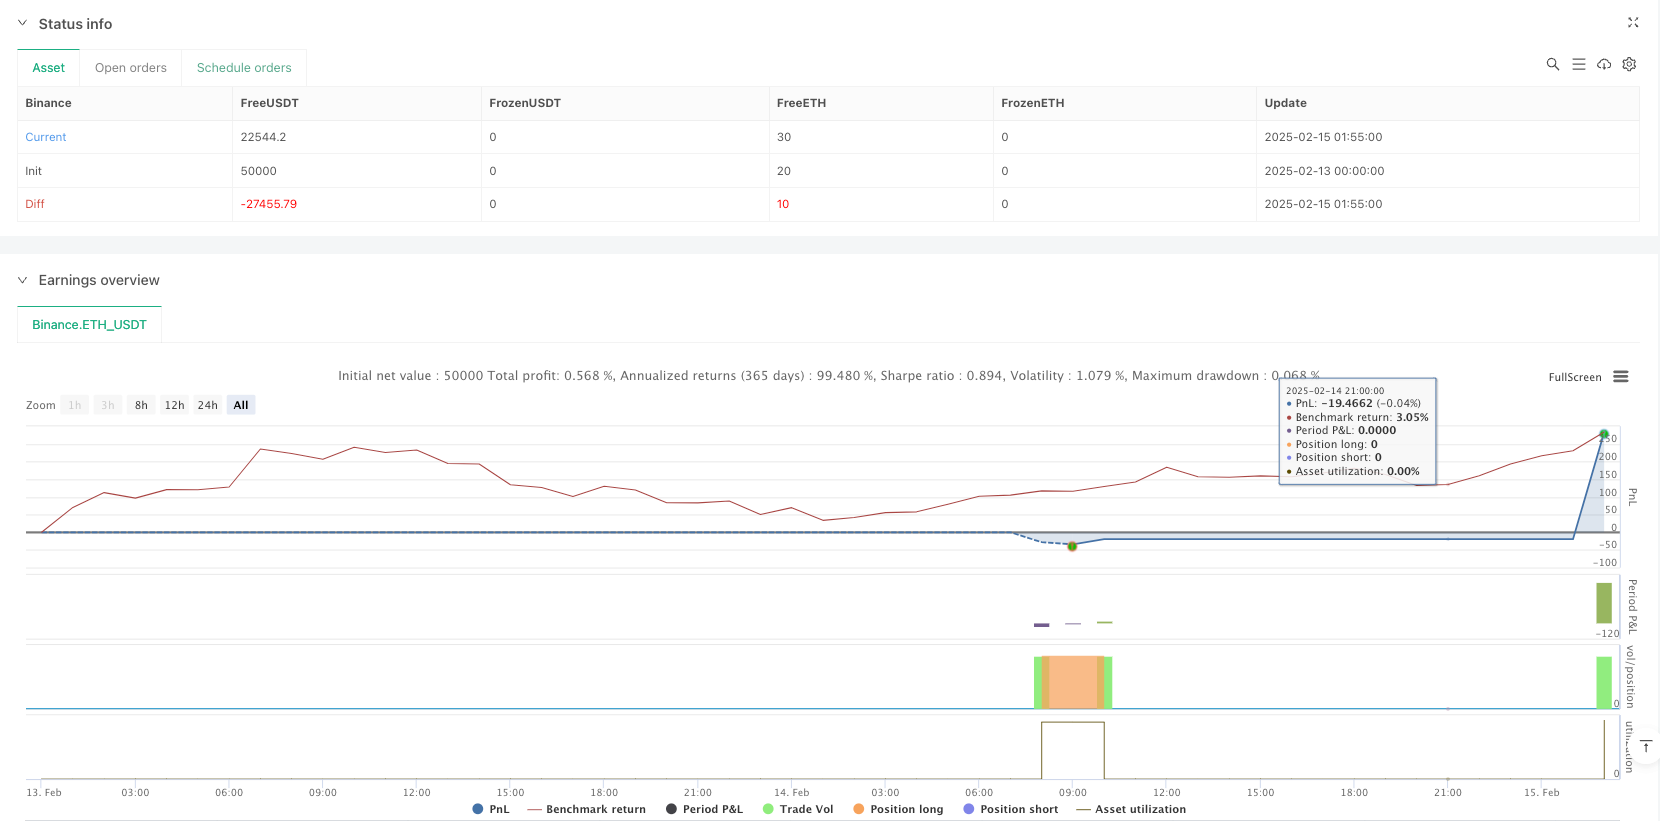
This strategy constructs a relatively complete trading system through the combination of multi-timeframe MACD indicators and EMA trend filters. Its strengths lie in its multiple confirmation mechanisms and comprehensive risk management, while attention needs to be paid to its adaptability in different market environments. Through the suggested optimization directions, the strategy has the potential to further improve its profitability while maintaining stability.
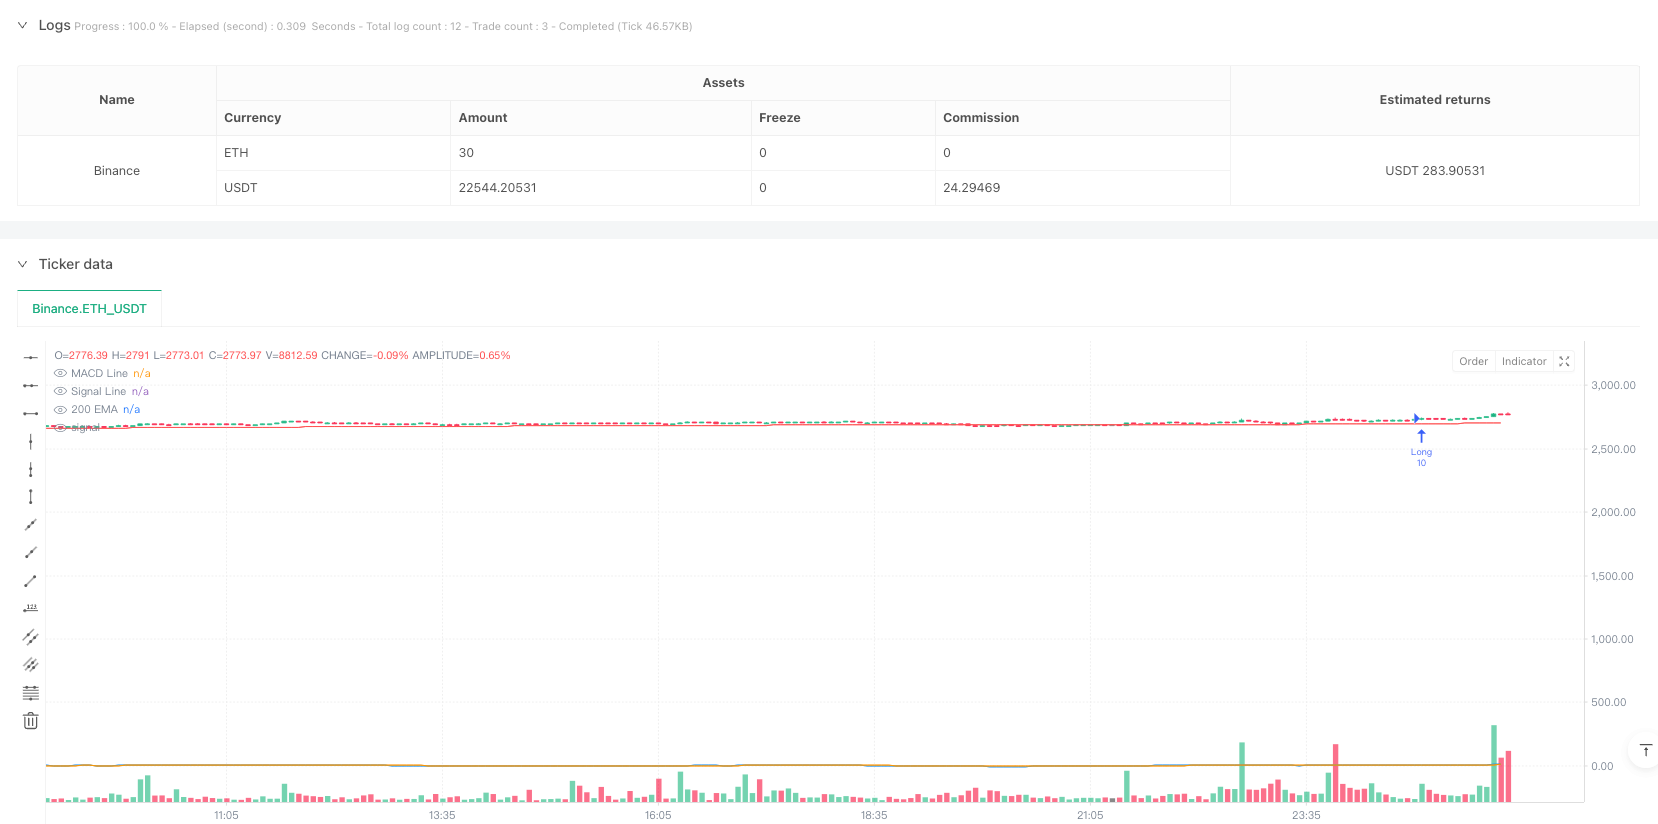
/*backtest
start: 2025-02-13 00:00:00
end: 2025-02-15 02:00:00
period: 5m
basePeriod: 5m
exchanges: [{"eid":"Binance","currency":"ETH_USDT"}]
*/

//@version=5
strategy("NQ MACD Continuation Backtest", overlay=true)

// MACD Settings
fastLength = 12
slowLength = 26
signalLength = 9

// 1-minute MACD
[macdLine, signalLine, _] = ta.macd(close, fastLength, slowLength, signalLength)

// 3-minute MACD for trend filter
[htfMacd, htfSignal, _] = request.security(syminfo.tickerid, "3", ta.macd(close, fastLength, slowLength, signalLength), lookahead=barmerge.lookahead_on)

// 200 EMA
ema200 = ta.ema(close, 200)

// Time Filters
inSession = (hour(time, "America/New_York") >= 9 and (hour(time, "America/New_York") > 9 or minute(time, "America/New_York") >= 45)) and (hour(time, "America/New_York") < 22 or (hour(time, "America/New_York") == 22 and minute(time, "America/New_York") == 30))
notRestricted = (hour(time, "America/New_York") >= 6 and hour(time, "America/New_York") < 22)

// Track Previous MACD Crosses
var bool bullishCrossed = false
var bool bearishCrossed = false
if (ta.crossover(macdLine, signalLine) and macdLine > 0)
    bullishCrossed := true
if (ta.crossunder(macdLine, signalLine) and macdLine < 0)
    bearishCrossed := true

// Define Continuation Signals with EMA and 3-Min MACD Filter
bullishContinuation = (ta.crossover(macdLine, signalLine) and macdLine > 0 and signalLine > 0 and htfMacd > htfSignal and bullishCrossed and close > ema200)
bearishContinuation = (ta.crossunder(macdLine, signalLine) and macdLine < 0 and signalLine < 0 and htfMacd < htfSignal and bearishCrossed and close < ema200)

// Entry Conditions with SL and 10 Contracts
if (bullishContinuation and inSession and notRestricted)
    strategy.entry("Long", strategy.long, qty=10, stop=close - 7 * syminfo.mintick)
if (bearishContinuation and inSession and notRestricted)
    strategy.entry("Short", strategy.short, qty=10, stop=close + 7 * syminfo.mintick)

// Break-Even Adjustment
if (strategy.position_size > 0 and close >= strategy.position_avg_price + 5 * syminfo.mintick)
    strategy.exit("BreakEvenLong", from_entry="Long", stop=strategy.position_avg_price)
if (strategy.position_size < 0 and close <= strategy.position_avg_price - 5 * syminfo.mintick)
    strategy.exit("BreakEvenShort", from_entry="Short", stop=strategy.position_avg_price)

// Display Indicators on Chart
plot(macdLine, color=color.blue, title="MACD Line")
plot(signalLine, color=color.orange, title="Signal Line")
plot(ema200, color=color.red, title="200 EMA")