Adaptive Dual Strategy System for Trend Following and Range Trading

ADX SMA BB RSI MACD ATR
Created on: 2025-02-21 10:14:04 Modified on: 2025-02-27 17:17:45
Copy: 1 Number of hits: 419
avatar of ianzeng123 ianzeng123
2
Follow
319
Followers

 Adaptive Dual Strategy System for Trend Following and Range Trading  Adaptive Dual Strategy System for Trend Following and Range Trading

Overview

This strategy is an adaptive trading system that combines trend following and range trading. The system dynamically identifies market conditions using the ADX indicator and applies different trading strategies in trending and ranging markets. In trending markets, the strategy uses moving average crossover signals combined with RSI and MACD confirmation; in ranging markets, it utilizes Bollinger Bands breakouts with RSI overbought/oversold signals. The system also incorporates a dynamic stop-loss and take-profit mechanism based on ATR for effective risk management.

Strategy Principles

The core of the strategy is the market condition identification mechanism. When ADX is above 25, itโ€™s considered a trending market, activating the trend following strategy: 1. Long condition: 50-day MA crosses above 200-day MA, with RSI above 50 and MACD line above signal line 2. Short condition: 50-day MA crosses below 200-day MA, with RSI below 50 and MACD line below signal line

When ADX is 25 or below, itโ€™s considered a ranging market, activating the range trading strategy: 1. 
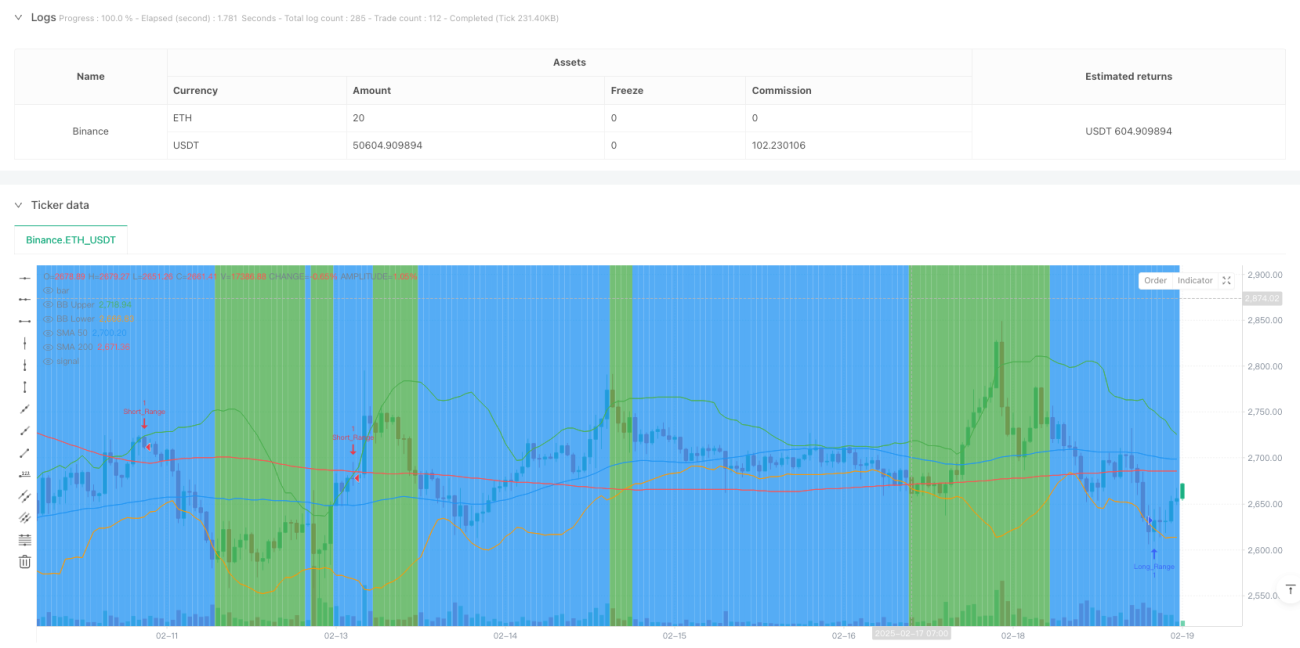
Long condition: Price crosses above lower Bollinger Band with RSI below 40 2. Short condition: Price crosses below upper Bollinger Band with RSI above 60

Stop-loss and take-profit levels are set using ATR multiples: 1.5x ATR for stop-loss and 3x ATR for take-profit.

Strategy Advantages

  1. High market adaptability: Automatically switches trading strategies based on market conditions
  2. Multiple signal confirmation: Reduces false signals through multiple technical indicator combinations
  3. Comprehensive risk control: Uses dynamic stop-loss and take-profit mechanism adapting to market volatility
  4. Clear strategy logic: Well-defined criteria for trend and range identification, easy to optimize
  5. Good visualization: Market conditions distinguished through background colors, intuitive display

Strategy Risks

  1. Signal lag: Moving averages and other indicators have inherent lag, potentially missing optimal entry points
  2. False breakout risk: Possible false Bollinger Band breakouts in ranging markets
  3. Parameter sensitivity: Strategy performance affected by ADX threshold, ATR multiplier settings
  4. Market transition risk: False signals possible during transitions between trending and ranging periods
  5. Stop-loss magnitude risk: Fixed ATR multiplier stops may be too wide in high volatility periods

Strategy Optimization Directions

  1. Incorporate volume analysis: Add volume factors in signal confirmation to improve reliability
  2. Optimize market condition identification: Consider dynamic ADX thresholds or additional indicators
  3. Enhance stop-loss mechanism: Implement trailing stops or dynamically adjust ATR multipliers based on volatility
  4. Add time filters: Implement trading time restrictions to avoid low liquidity periods
  5. Improve signal confirmation: Consider adding price pattern analysis to enhance signal quality

Summary

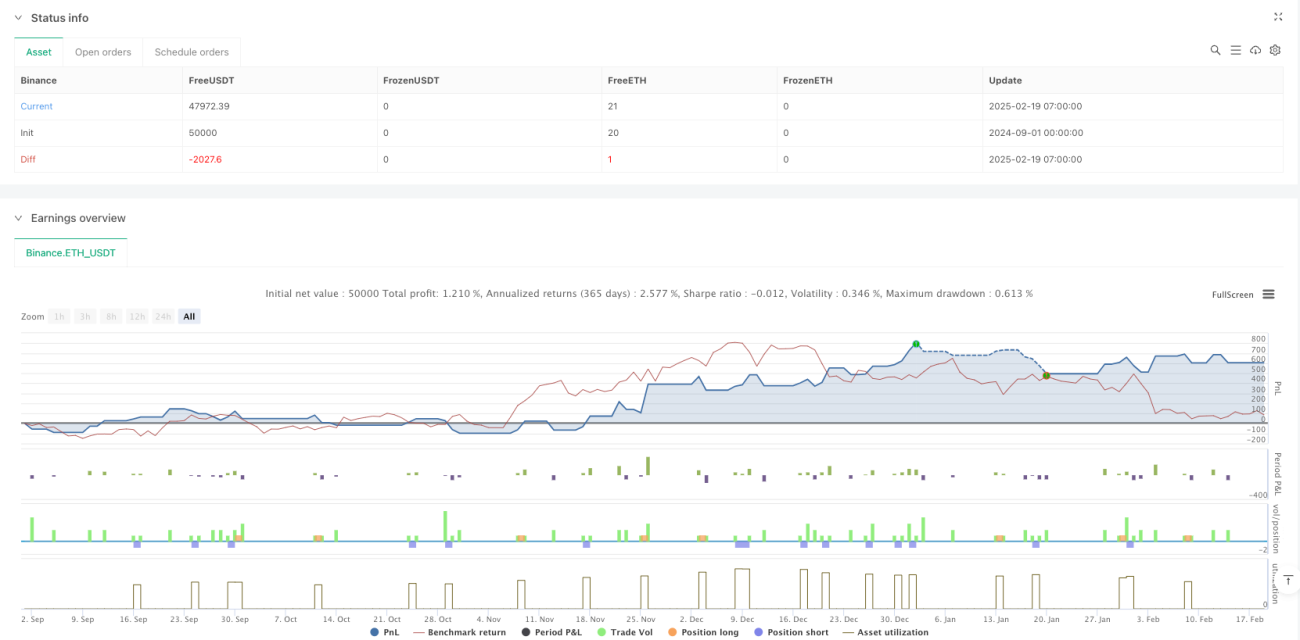
The strategy achieves adaptation to different market environments through dynamic market condition identification and corresponding strategy switching. Through the combination of multiple technical indicators and dynamic risk control mechanisms, the strategy demonstrates good practicality. However, attention should be paid to signal lag and false breakout risks, and thorough testing and parameter optimization in live trading is recommended.

Strategy source code
/*backtest
start: 2024-09-01 00:00:00
end: 2025-02-19 08:00:00
period: 1h
basePeriod: 1h
exchanges: [{"eid":"Binance","currency":"ETH_USDT"}]
*/

//@version=6
strategy("Trend vs Range Trading - Fully Fixed for v6", overlay=true)

// ๐Ÿ”น Moving Averages (SMA 50 & 200)
sma50 = ta.sma(close, 50)
sma200 = ta.sma(close, 200)

// ๐Ÿ”น Proper ADX Calculation (With Corrected ta.dmi() Parameters)
dmiLength = 14
adxSmoothing = 14
[dmiPlus, dmiMinus, adx] = ta.dmi(dmiLength, adxSmoothing)

// ๐Ÿ”น Bollinger Bands Calculation (Fixed for v6)
bb_length = 20
bb_mult = 2.0
bb_basis = ta.sma(close, bb_length)
bb_dev = ta.stdev(close, bb_length)
bb_upper = bb_basis + (bb_mult * bb_dev)
bb_lower = bb_basis - (bb_mult * bb_dev)

// ๐Ÿ”น Additional Indicators (RSI & MACD)
rsi = ta.rsi(close, 14)
[macdLine, signalLine, _] = ta.macd(close, 12, 26, 9)

// ๐Ÿ”น ATR for Stop Loss & Take Profit
atr = ta.atr(14)
stop_loss_mult = 1.5  // Stop Loss Multiplier
take_profit_mult = 3.0  // Take Profit Multiplier

// ๐Ÿ”น Trend vs Range Market Detection
is_trending = adx > 25

// ๐Ÿ”น Trend Following Strategy (SMA Cross & Confirmation)
long_condition_trend = is_trending and ta.crossover(sma50, sma200) and rsi > 50 and macdLine > signalLine
short_condition_trend = is_trending and ta.crossunder(sma50, sma200) and rsi < 50 and macdLine < signalLine

// ๐Ÿ”น Range Trading Strategy (Bollinger Bands & RSI Confirmation)
long_condition_range = not is_trending and ta.crossover(close, bb_lower) and rsi < 40
short_condition_range = not is_trending and ta.crossunder(close, bb_upper) and rsi > 60

// ๐Ÿ”น Stop Loss & Take Profit Calculations
long_stop_loss = close - (atr * stop_loss_mult)
long_take_profit = close + (atr * take_profit_mult)
short_stop_loss = close + (atr * stop_loss_mult)
short_take_profit = close - (atr * take_profit_mult)

// ๐Ÿ”น Execute Trades (With Stop Loss & Take Profit)
if long_condition_trend
    strategy.entry("Long_Trend", strategy.long)
    strategy.exit("Exit_Long_Trend", from_entry="Long_Trend", stop=long_stop_loss, limit=long_take_profit)

if short_condition_trend
    strategy.entry("Short_Trend", strategy.short)
    strategy.exit("Exit_Short_Trend", from_entry="Short_Trend", stop=short_stop_loss, limit=short_take_profit)

if long_condition_range
    strategy.entry("Long_Range", strategy.long)
    strategy.exit("Exit_Long_Range", from_entry="Long_Range", stop=long_stop_loss, limit=long_take_profit)

if short_condition_range
    strategy.entry("Short_Range", strategy.short)
    strategy.exit("Exit_Short_Range", from_entry="Short_Range", stop=short_stop_loss, limit=short_take_profit)

// ๐Ÿ”น Visual Indicators & Background Color (Trend vs Range)
bgcolor(is_trending ? color.green : color.blue)

// ๐Ÿ”น Plot Moving Averages & Bollinger Bands
plot(sma50, color=color.blue, title="SMA 50")
plot(sma200, color=color.red, title="SMA 200")
plot(bb_upper, color=color.green, title="BB Upper")
plot(bb_lower, color=color.orange, title="BB Lower")