Dynamic Range Breakout Trading Strategy Based on Bollinger Bands and RSI

Overview
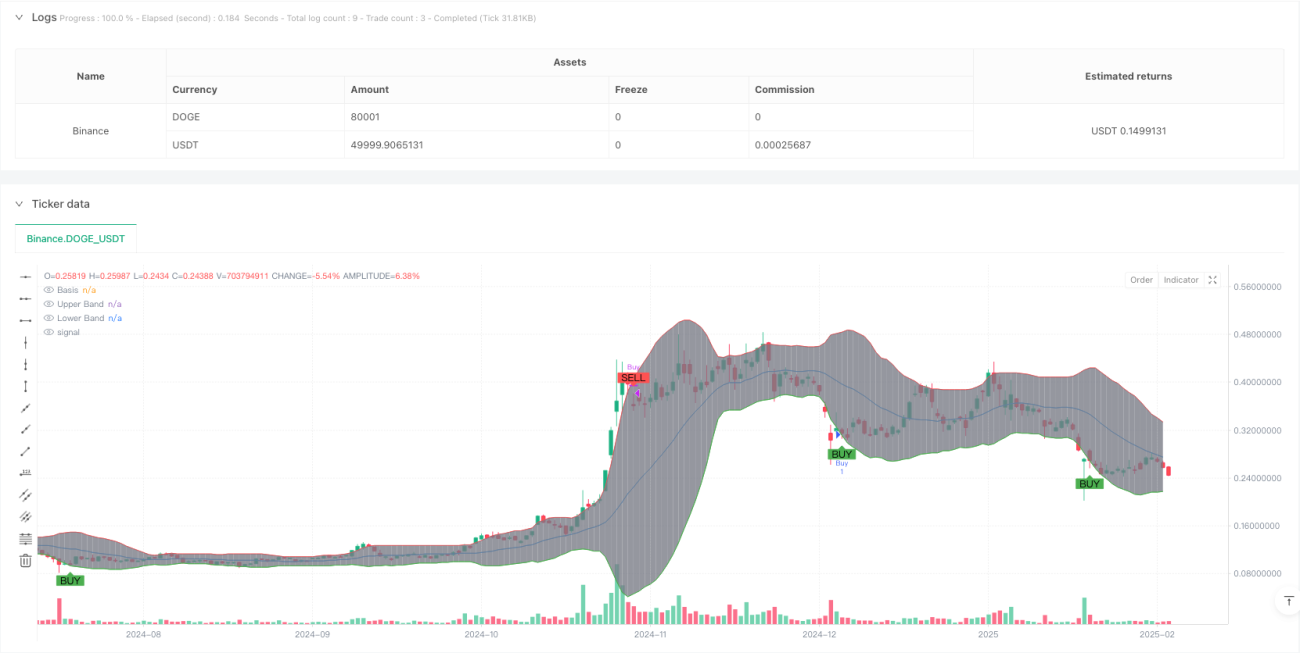
This strategy is a dynamic range trading system combining Bollinger Bands and Relative Strength Index (RSI). It captures market turning points by monitoring price crossovers with Bollinger Bands and RSI overbought/oversold levels. The core idea is to seek rebound opportunities in oversold markets and take profits in overbought conditions.
Strategy Principles
The strategy employs 20-period Bollinger Bands and 14-period RSI as core technical indicators. Bollinger Bands consist of three lines: middle band (20-period SMA), upper band (middle + 2SD), and lower band (middle - 2SD). Buy signals are triggered when two conditions are met simultaneously: price crosses above the lower band and RSI is below 45 (1.5 times the standard 30). Sell signals occur when price crosses below the upper band and RSI is above 70. This design considers both price trends and momentum indicators, effectively reducing false breakout risks.
Strategy Advantages
- Strong Dynamic Adaptation: Bollinger Bands automatically adjust range width based on market volatility, enabling strategy adaptation to different market environments.
- Multiple Confirmation Mechanism: Combining price breakouts and RSI reduces false signal risks.
- Reasonable Risk Control: Bollinger Bands provide clear support/resistance levels for stop-loss and take-profit placement.
- Flexible Parameter Settings: Bollinger Band multiplier and RSI thresholds can be adjusted for different market characteristics.
- Good Visualization: Strategy clearly marks buy/sell signals on charts for analysis and backtesting.
Strategy Risks
-
Sideways Market Risk: May generate frequent false breakout signals in ranging markets.
Suggestion: Add trend filters to only trade in clear trends. -
Lag Risk: Moving average calculations may affect signal timeliness.
Suggestion: Consider using shorter-period indicators for confirmation. -
Over-optimization Risk: Parameter optimization may lead to overfitting historical data.
Suggestion: Test thoroughly across different timeframes and market conditions.
Strategy Optimization Directions
-
Add Trend Filters: Introduce ADX or long-term moving averages to assess trend strength and only trade in clear trends.
-
Optimize Stop Loss Settings: Implement dynamic stop-loss placement based on ATR for more flexible risk control.
-
Incorporate Volume Confirmation: Add volume analysis requiring increased volume on breakouts for improved signal reliability.
-
Enhanced Position Management: Automatically adjust position sizes based on market volatility and account risk levels.
Summary
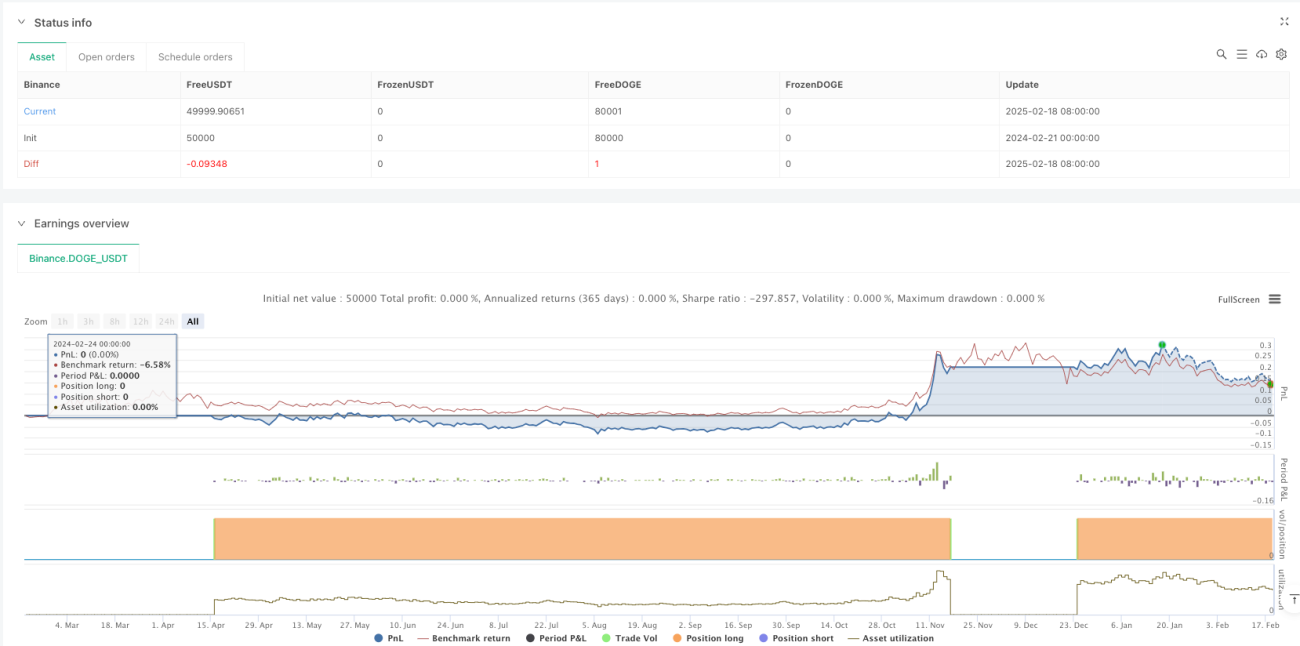
This mature strategy combines classic technical analysis indicators, using Bollinger Bands and RSI to capture major trends while controlling risks. The strategy design is clear, implementation is concise, and it demonstrates good practicality. While inherent risks exist, a robust trading system can be built through appropriate parameter settings and risk management measures. Traders are advised to thoroughly test and optimize according to specific market characteristics before live trading.
- 1