
Overview
This strategy is a comprehensive trend following trading system that combines multiple technical indicators to determine market trends and trading opportunities. The core strategy is based on the crossover signals of fast and slow Simple Moving Averages (SMA), confirmed by the Relative Strength Index (RSI) and Average Directional Index (ADX), while using Average True Range (ATR) for risk management. The strategy implements money management principles, limiting single trade risk to no more than 2% of account equity.
Strategy Principles
The strategy operates through several key components:
- Trend Identification: Uses SMA10 and SMA200 crossovers to capture trend changes, with fast line crossing above slow line as buy signal and vice versa.
- Trend Confirmation: Double confirmation through RSI and ADX, requiring RSI to break above 50 level and ADX above 20 to confirm trend strength.
- Risk Control: Dynamic stop-loss setting based on ATR and position sizing limits per trade.
- Position Management: Implements trailing stop mechanism to dynamically adjust stop-loss positions to lock in profits.
Strategy Advantages
- Multiple indicator cross-validation improves signal reliability
- Combination of trend strength and momentum indicators reduces false breakout risks
- Comprehensive risk management system including position control and dynamic stop-loss
- Applicable across multiple timeframes (M5-MN), demonstrating strong adaptability
- Supports hedging, expanding strategy application scenarios
Strategy Risks
- May generate frequent false signals in ranging markets
- Long-period moving averages have significant lag, potentially missing early trend opportunities
- Multiple indicator filtering might miss some valid signals
- Fixed indicator parameters may not suit all market environments
- Transaction costs may impact profitability in shorter timeframes
Strategy Optimization Directions
- Introduce adaptive indicator parameters that adjust dynamically with market volatility
- Add market environment recognition mechanism to apply different strategy parameters
- Optimize stop-loss approach, considering support and resistance levels
- Incorporate volume indicators to improve signal reliability
- Develop market switching mechanism to automatically stop trading in unsuitable conditions
Summary
The strategy establishes a relatively complete trend following trading system through the combined application of multiple technical indicators. The design emphasizes signal reliability and risk management, demonstrating good practicality. Through implementation of optimization suggestions, the strategy has potential for further performance improvement. It is recommended to conduct thorough backtesting before live implementation and optimize parameters according to specific trading instrument characteristics.
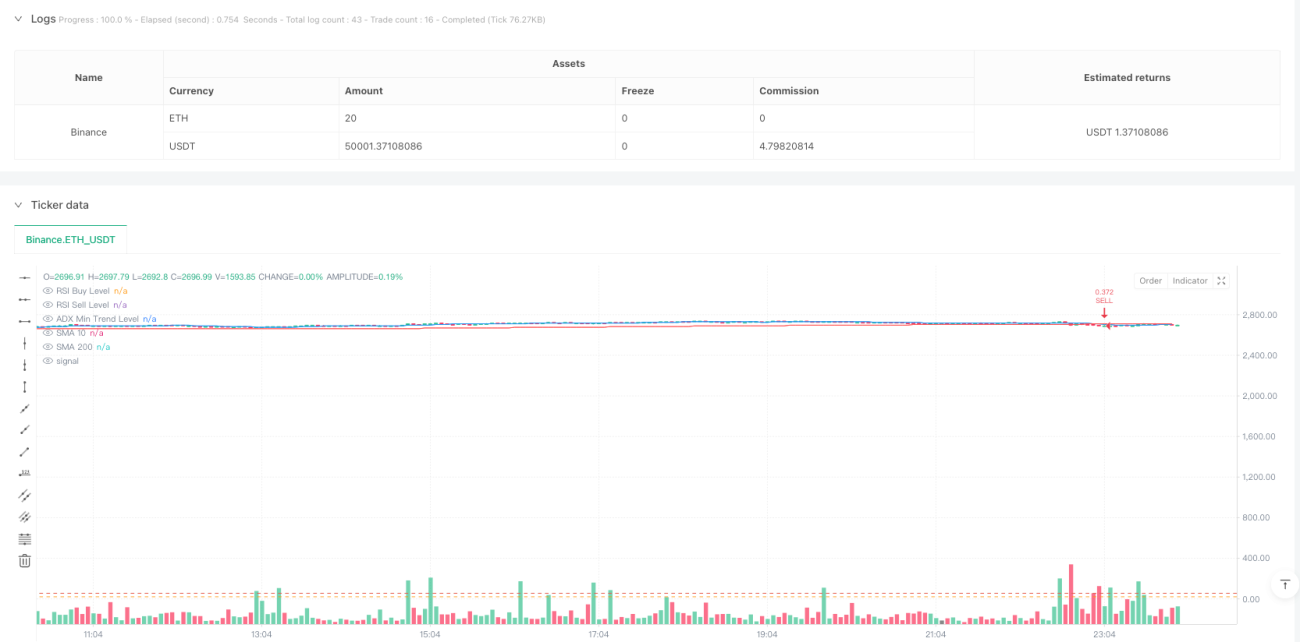
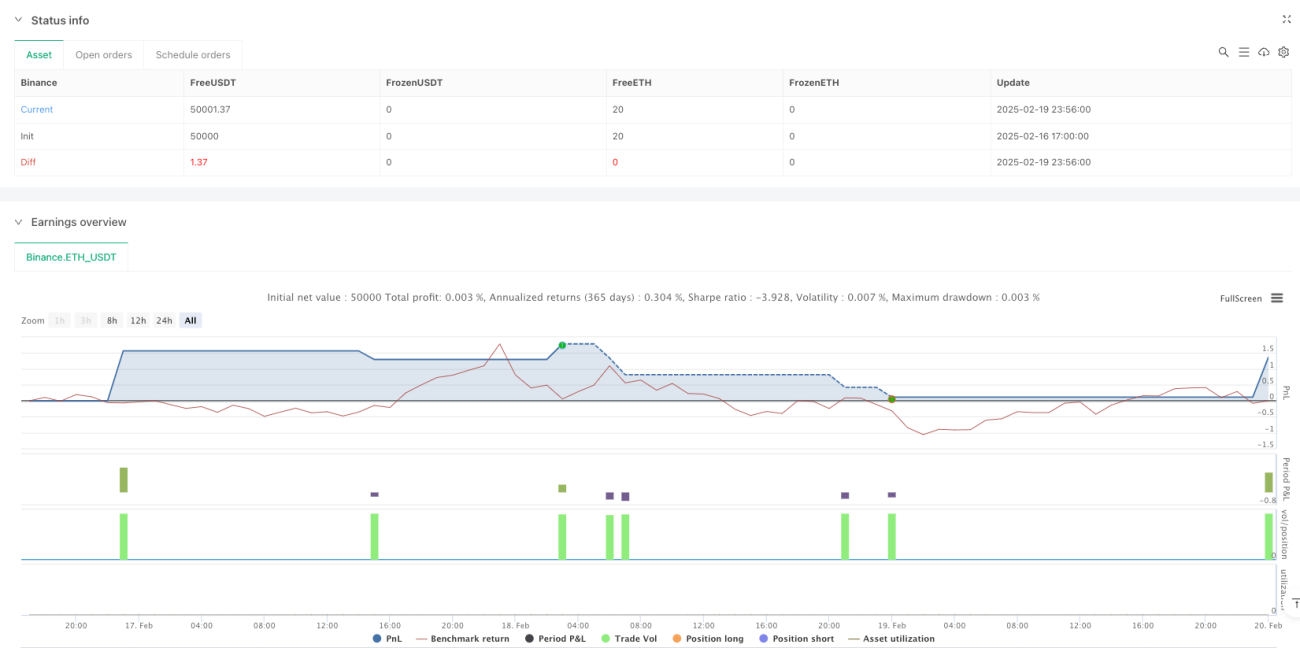
/*backtest
start: 2025-02-16 17:00:00
end: 2025-02-20 00:00:00
period: 4m
basePeriod: 4m
exchanges: [{"eid":"Binance","currency":"ETH_USDT"}]
*/

//@version=6
strategy("SMA + RSI + ADX + ATR Strategy", overlay=true, default_qty_type=strategy.percent_of_equity, default_qty_value=2)

// === Input Parameters ===- 1